
Blank map of France
France's 101 departments, the 96 of the mainland and Corsica and the 5 overseas, ready to colour, number or print.
- Free
- Printable PDF
- 101 departments
- No account
Layers
Eraser
What it does
Erase from
Start with…
France's 101 departments, the 96 of the mainland and Corsica and the 5 overseas, ready to colour, number or print.
The overseas departments (Guadeloupe, Martinique, French Guiana, Réunion and Mayotte) are in their real places; zoom to each or add them as separate pictures. Group departments into the 18 regions with one legend colour per region.
What you can make
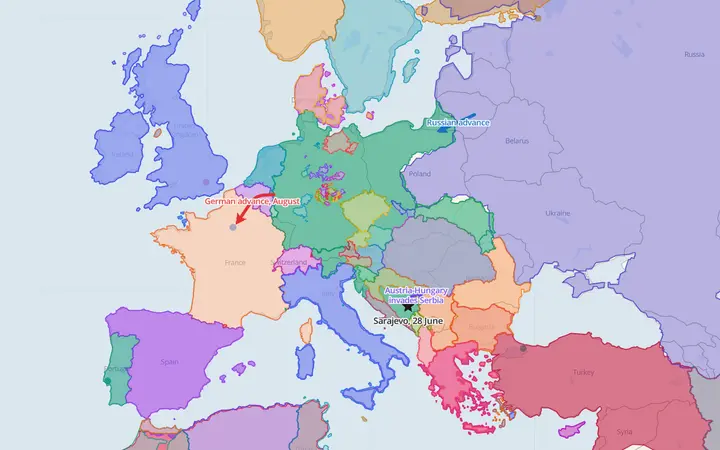 Europe in 1914The borders of 1914, with the first moves of the First World War drawn over them.
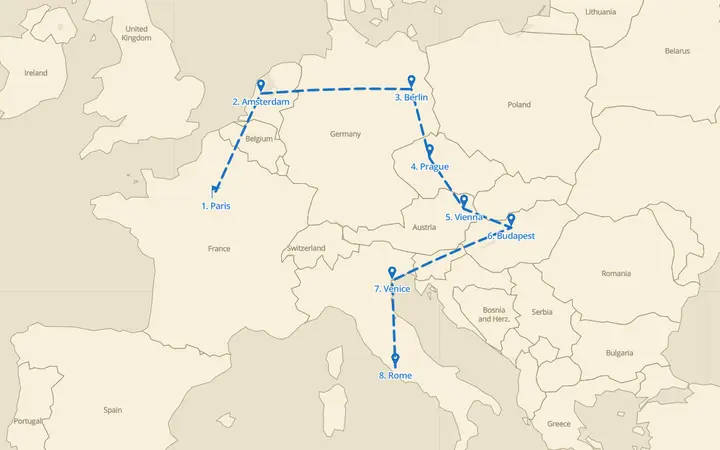 A rail trip across EuropeEight cities by train, with numbered markers and a dashed route.
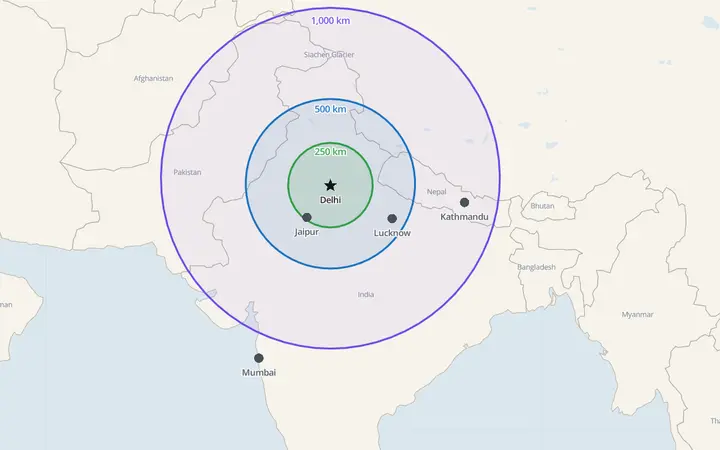 How far from Delhi?Circles of 250, 500 and 1,000 km measured on the globe, with the cities inside them.
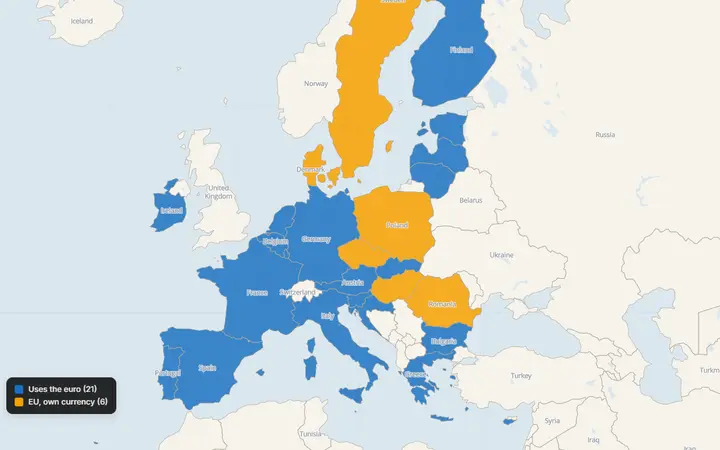 The euro area in 2026Countries coloured in with two legend colours: 21 use the euro, 6 EU members keep their own currency.
What you can do
Every drawing tool
Markers, text, lines, arrows, curved arrows, areas, boxes, circles, a freehand pen and a measuring tool.
Any year, 3000 BC to today
Move the timeline and the borders change with it. Give a drawing a start and end year and it appears only then.
Colour in countries
Tap countries, states, provinces or empires to colour them, with a legend of colours and patterns you can rename.
Real data underneath
Cities, rivers, voyages, World Heritage Sites, tectonic plates and more, ready to copy into your drawing.
True distances and areas
Circles of an exact radius, distances and areas, measured along the curve of the Earth.
Share and export
A link to share, PNG for slides, PDF for print, and GeoJSON, KML or GPX for other mapping tools.
How it works
Open France
The map opens on France, departments drawn and ready. In Layers, switch off Country names for a blank outline, or keep them as a key.
Colour, label or number it
Tap one of the departments to colour it with the colour in use; rename the colours in the Legend. Add text labels, numbered markers for a quiz, or arrows.
Print or share
Export a PDF on A4 or US Letter for a worksheet, a PNG for slides, or share a link that opens your map for anyone to copy and finish.
Data you can cite
- Natural EarthPublic domainCountries, coastlines and the simple base map
- Cliopatria (Seshat)CC BY 4.0Borders of 1,600+ states and empires, 3000 BC to today
- OpenStreetMapODbLStreets and places on the detailed base maps
- geoBoundariesOpen licences, per countryDistrict lines inside countries
Every exported picture prints the credits of the data on it. All sources: data sources.
Your maps stay yours
- Your map is saved in this browser as you draw. No account, no sign-in.
- Files you open (GeoJSON, KML, GPX, CSV) are read in your browser and never uploaded.
- A short link stores a copy of the map only when you make one, so the link works for anyone you send it to.
- What you draw is yours to use in lessons, articles, books and slides; keep the data credits on it.
Visit statistics and cookies are explained on the privacy page.
Questions
Can I colour the regions of France?
Yes. Make one legend colour per region and tap its departments; the legend names the regions on the printed map.
Are the overseas departments included?
Yes, all five, in their true places in the Caribbean, South America and the Indian Ocean.
Is YearMaps Draw free?
Yes. Drawing, sharing links and exporting PNG, PDF, GeoJSON, KML and GPX files are all free, with no account. Exported pictures carry a small @yearmaps.com mark and the credits of the data on the map.
Do I need an account to save my map?
No. Your map is saved in your browser as you draw. To keep it elsewhere, share its link, or save a YearMaps file and open it again later from the File menu.
Can I use the maps I make?
Yes. The map belongs to you, in school work, articles, presentations and books. Keep the data credits printed on the picture: the borders come from Cliopatria (CC BY 4.0) and the base map from Natural Earth (public domain).
Can I import my own data?
Yes. Open or drop GeoJSON, KML, KMZ (Google Earth) and GPX (GPS) files onto the map. They are read in your browser and never uploaded.
More ways to use it
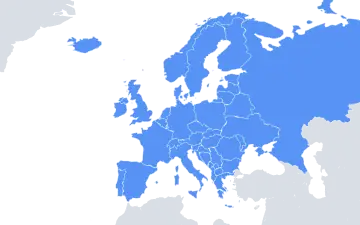 Blank map of EuropeThe 50 countries of Europe, from Iceland to Russia, outlined and ready to print blank or to colour and label online.
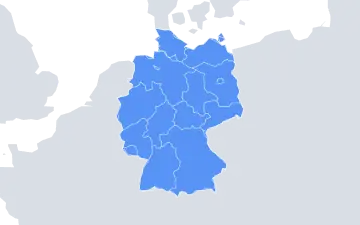 Blank map of GermanyGermany's 16 federal states, from Schleswig-Holstein to Bavaria, ready to colour, label or print.
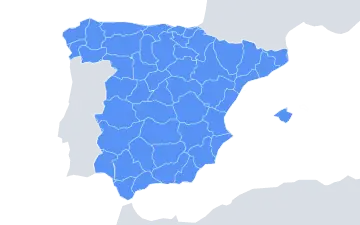 Blank map of SpainSpain's 50 provinces with the Balearic and Canary Islands, Ceuta and Melilla, ready to colour by autonomous community, label or print.
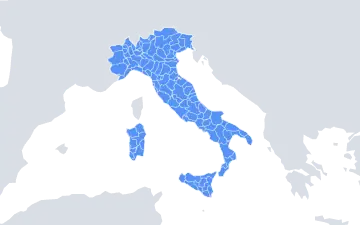 Blank map of ItalyItaly by its provinces, Sicily and Sardinia included, ready to colour by region, label or print.
- Colour a map of countriesTap countries to colour them, build a legend with names and patterns, and switch between the world, a continent or a country by its states.
- Map maker for teachersMake the map for today's lesson in minutes: a blank or historical base, your labels and arrows, then a PDF for the worksheet or a link for the class.
Every map page on YearMaps has a Draw on this map button in its Share panel, which opens the same view here. See what's new in YearMaps Draw.