Skip to content
YearMaps

What Earth Looked Like Through Time

Spin a 3D globe and drag the slider from Earth’s molten birth 4.5 billion years ago to today. Continents glide plate by plate between the maps, with today’s coastlines riding along so you can see where your country was. Watch Pangea come together and break apart, Snowball Earth, the asteroid that ended the dinosaurs and the last ice age on the globe itself, switch on temperature, rainfall or climate zones, and tap a landform such as the Himalaya to see how it formed.

3D globe · drag the slider through time

Earth Through Time

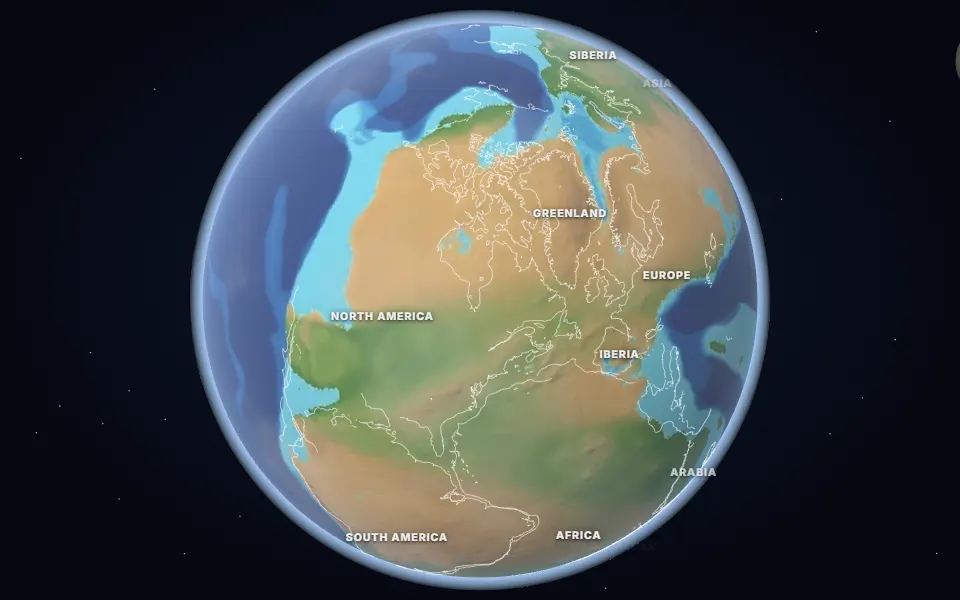
Globe of Earth 250 million years ago showing the supercontinent Pangea wrapped around the Tethys Ocean
Temp (GMST)—
CO₂—
O₂—
250 million years agoMesozoic Era · Triassic Period

Two fingers to turn and zoom

Land height and sea depth (PALEOMAP), coloured by rainfall, with ice where it was coldest.

Pangea and the Great Dying

Almost all land is joined in one supercontinent, Pangea, wrapped around the Tethys Ocean. The world has just lived through the worst mass extinction in its history.

  • The Great Dying

    252 million years ago · Siberian Traps, Russia

    Volcanic eruptions in Siberia released vast amounts of CO2, heating the planet and suffocating the oceans. About 90% of marine species died.

Maps: Ancient maps: PALEOMAP PaleoDEMs (Scotese & Wright 2018), CC BY 4.0 · Climate: PALEOMAP (Scotese et al. 2021, 2024), CC BY 4.0 · Temperature: Scotese et al. 2021, CC BY 4.0 · Ice-age ice sheets: PaleoMIST (Gowan et al. 2021), CC BY 4.0 · Natural Earth. Event positions rotated to their ancient places with the PALEOMAP plate model. Animations are illustrations built on these maps.

Geological Epochs · Deep-Time Chronicles

The 12 Crucial Epochs of Earth History

Each chapter explores a pivotal era in planetary history, connecting the 3D globe with radiometric records, the theories that explain them and the scientists who worked them out.

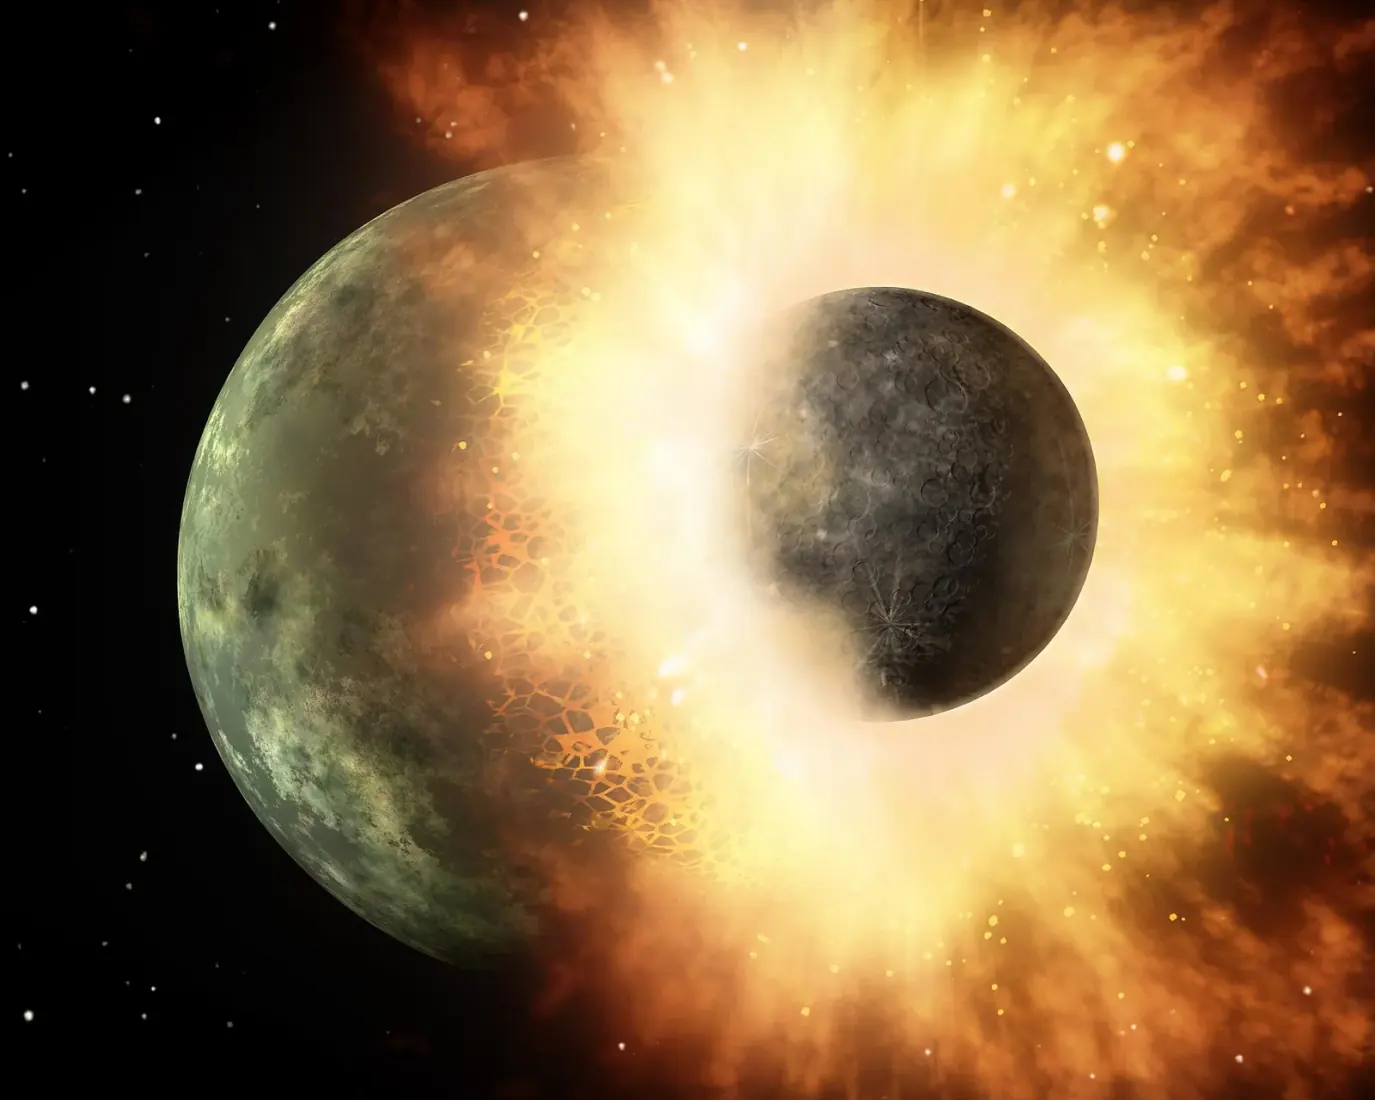
Artist illustration of the giant impact: protoplanet Theia colliding with the infant Earth, melting the crust into a magma ocean and throwing off debris to form the Moon.
Era 1 of 12Early HadeanHadean Eon

4.5 billion years ago

A Magma Ocean and a New Moon

Our globe · 4.5 billion years agoThe reconstruction on this page, drawn from the plate model.

How did the Earth and Moon form?

Earth was tens of millions of years old when a Mars-sized protoplanet, Theia, collided with it in an oblique cataclysm. The impact melted the mantle into a global magma ocean hundreds of kilometers deep and flung a vaporized disk of molten rock into orbit that coalesced within months into our Moon.

Temperature
> 230 °C
CO₂
> 100,000 ppm
O₂
< 0.0001%
Day length
5.5 hours
Sea level
No oceans yet

Key milestones

  1. Theia Impact Cataclysmt = 0 hours

    Mars-sized protoplanet strikes Earth at 10 km/s, vaporizing both cores.

  2. Debris Disk Ejectiont = 24 hours

    Silicate vapor and liquid magma form a Keplerian ring outside the Roche limit.

  3. Accretion of the MoonMonths to centuries

    Gravitational runaway coagulates the debris ring into the newborn Moon only 25,000 km away.

On the globe 4 pointers

  • Theia Impact Epicenter

    10°N, 20°W

    Oblique collision site where Mars-sized protoplanet Theia excavated Earth’s proto-mantle.

  • Global Magma Ocean

    0°N, 20°E

    Circumferential molten ultramafic rock ocean exceeding 1,500 °C, differentiating iron into the core.

  • Superheated Steam Atmosphere

    15°S, 45°W

    Dense supercritical water vapor and carbon dioxide blanketing the incandescent globe.

  • Nascent Lunar Orbit

    25°N, 5°E

    Gravitational tidal focus where expelled circumterrestrial silicate debris accreted into the Moon.

Theories and models

  • Giant Impact Hypothesis1975

    Explains the Moon’s depleted iron core and identical oxygen isotope composition via a collision with protoplanet Theia.

  • Magma Ocean Fractional Crystallization1970

    Heavy olivine and pyroxene crystallized and sank while plagioclase feldspars floated to form early crustal rinds.

  • Steam Atmosphere Thermal Blanketing1986

    Runaway greenhouse steam prevented crustal cooling until atmospheric condensation rainout at ~4.4 Ga.

Pioneers

  • William K. Hartmann & Donald R. Davis

    Planetary Scientists (Planetary Science Institute)

    First formulated the modern Giant Impact Hypothesis in 1975 to explain the Apollo lunar rock findings.

  • Alastair G.W. Cameron

    Astrophysicist (Harvard University, 1925–2005)

    Conducted the first quantitative computer hydrodynamic simulations of the Mars-sized Theia collision.

  • Clair Patterson

    Geochemist (Caltech, 1922–1995)

    Determined the true 4.55-billion-year radiometric lead-isotope age of Earth and the solar system in 1953.

Artist illustration of the giant impact: protoplanet Theia colliding with the infant Earth, melting the crust into a magma ocean and throwing off debris to form the Moon. · NASA / JPL-Caltech · Public Domain ↗

Era 2 of 12Late Hadean / EoarcheanArchean Eon

4 billion years ago

The First Oceans & Ancient Crust

Photograph · the evidenceThe Acasta Gneiss of the Northwest Territories, Canada. Dating to 4.03 billion years ago, it is the oldest known intact piece of continental crust on Earth.Geological Survey of Canada / Natural Resources Canada · Open Government Licence - Canada ↗
Our globe · 4 billion years agoThe reconstruction on this page, drawn from the plate model.

When did liquid oceans and the first stable continents appear?

As the steam atmosphere condensed, torrential rains flooded the crust into Earth’s first oceans. Tiny zircon crystals from Jack Hills, Western Australia, prove cool liquid water existed by 4.4 Ga, while northern Canada’s Acasta Gneiss preserves the oldest surviving bedrock on our planet.

Temperature
45–85 °C
CO₂
~60,000 ppm
O₂
< 0.001%
Day length
9.0 hours
Sea level
Global water world

Key milestones

  1. Steam Condensation Deluge~4.40 Ga

    Centuries of torrential rains fill the ocean basins with acidic, mineral-rich seawater.

  2. Craton Nucleation~4.03 Ga

    Felsic magmas cool into tonalite-trondhjemite-granodiorite (TTG) proto-continents.

  3. Emergence of Metabolic Life~3.9–3.8 Ga

    Chemoautotrophic microbes establish carbon fixation around seafloor hydrothermal vents.

On the globe 4 pointers

  • Acasta Continental Gneiss

    65°N, 115°W

    The oldest known preserved continental bedrock on Earth (dating to 4.03 Ga) in northern Canada.

  • Jack Hills Zircon Ocean Bed

    26°S, 116°E

    Western Australia detrital zircons recording chemical proof of liquid water oceans at 4.4 Ga.

  • Hydrothermal Vent Chimneys

    10°S, 30°W

    Serpentinizing ultramafic seafloor vents providing chemical proton gradients for primordial life.

  • Late Heavy Bombardment Basin

    15°N, 30°E

    Giant multi-ring impact basin excavated by migrating giant gas planets stirring Kuiper belt comets.

Theories and models

  • Zircon Ti-in-Zircon Paleothermometry2005

    Oxygen isotope ratios in Jack Hills zircons prove low-temperature granitic melts and liquid oceans by 4.4 Ga.

  • Nice Model Late Heavy Bombardment (LHB)2005

    Resonant migration of Jupiter and Saturn scattered asteroids and icy comets onto the inner terrestrial worlds.

  • Alkaline Hydrothermal Vent Origin of Life1993

    Iron-sulfur mineral micro-cavities acted as inorganic cell membranes fueled by proton motive force.

Pioneers

  • John Valley & Simon Wilde

    Geochemists (Univ. of Wisconsin & Curtin Univ.)

    Discovered the 4.4-billion-year-old Jack Hills zircons, overturning the idea of a dry, hellish Hadean.

  • Stephen Moorbath

    Geochronologist (Oxford University, 1929–2016)

    Pioneered isotopic dating of the earliest Archean rocks in Greenland and the Canadian Shield.

  • Michael Russell

    Geochemist (NASA JPL, b. 1939)

    Formulated the alkaline hydrothermal chimney model of the energetic origin of life.

Era 3 of 12Siderian PeriodPaleoproterozoic Eon

2.4 billion years ago

The Great Oxidation Event & Snowball

Photograph · the evidenceAlternating red jasper and silver-gray hematite in a 2.4-billion-year-old Banded Iron Formation (BIF), deposited when cyanobacterial oxygen rusted the world’s oceans.USGS / James St. John · CC BY 2.0 ↗
Our globe · 2.4 billion years agoThe reconstruction on this page, drawn from the plate model.

How did biological oxygen transform the atmosphere and trigger global ice?

Photosynthetic cyanobacteria generated vast quantities of oxygen. Once the ocean’s dissolved iron was oxidized into colossal Banded Iron Formations, free oxygen spilled into the atmosphere. It eradicated the warming methane greenhouse, plunging Earth into the global Huronian glaciation.

Temperature
−20 °C to 5 °C
CO₂
Declining from 20,000 to ~2,000 ppm
O₂
Surging from < 0.001% to ~1–2%
Day length
17.5 hours
Sea level
Lowered by continental ice sheets

Key milestones

  1. Dissolved Iron Buffer Exhaustion~2.45 Ga

    Marine iron sinks saturate; free oxygen begins escaping directly into the atmosphere.

  2. Atmospheric Photochemical Shift~2.40 Ga

    MIF-S signature vanishes; stratospheric ozone shield begins shielding surface waters.

  3. Huronian Global Freeze~2.4–2.1 Ga

    Earth enters a 300-million-year ice age as greenhouse warming collapses.

On the globe 4 pointers

  • Banded Iron Formation Shelf

    47°N, 90°W

    Precipitation of billions of tons of dissolved oceanic ferrous iron into ferric oxide rust bands.

  • Cyanobacterial Stromatolite Reef

    22°S, 118°E

    Photosynthetic microbial communities releasing dioxygen as a metabolic byproduct.

  • Huronian Equatorial Glacial Till

    46°N, 82°W

    Glaciogenic diamictites proving ice sheets reached equatorial latitudes as methane collapsed.

  • Stratospheric Ozone Layer

    0°N, 0°E

    Formation of the UV-absorbing O₃ shield enabling future complex life on land.

Theories and models

  • Great Oxidation Event (GOE) Paradigm1968

    Mass-independent fractionation of sulfur isotopes (MIF-S) disappears at 2.4 Ga, marking permanent atmospheric O₂.

  • Methane Greenhouse Collapse Hypothesis2001

    Free oxygen reacted with atmospheric methane (CH₄ + 2O₂ → CO₂ + 2H₂O), ending the super-greenhouse.

  • Banded Iron Deposition Cycle1973

    Seasonal upwelling of anoxic Fe²⁺ waters met oxygenated surface waters, dropping insoluble rust.

Pioneers

  • Preston Cloud

    Biogeologist (USGS & UCSB, 1912–1991)

    First recognized the connection between banded iron formations, early plant life, and oxygen accumulation.

  • Heinrich (Dick) Holland

    Geochemist (Harvard & Penn, 1927–2012)

    Quantified the chemical evolution of the atmosphere and ocean through paleosols and detrital uraninite.

  • Lynn Margulis

    Evolutionary Biologist (Univ. of Massachusetts, 1938–2011)

    Formulated the endosymbiotic theory: oxygen forced surviving microbes to merge into complex eukaryotes.

Era 4 of 12Stenian PeriodMesoproterozoic Eon

1.1 billion years ago

The Supercontinent Rodinia

Map and data · the evidencePaleogeographic reconstruction of supercontinent Rodinia at 900–1100 Ma, with Laurentia (ancient North America) assembled at the global heart of the landmass.Christopher Scotese (PALEOMAP) / John Goodge / Wikimedia Commons · CC BY-SA 3.0 ↗
Our globe · 1 billion years agoThe nearest reconstruction on the globe.

What was the supercontinent Rodinia and how did it assemble?

Almost all continental cratons collided into the giant supercontinent Rodinia, with Laurentia (ancient North America) situated at its heart. The collision raised the worldwide Grenville mountain belt, rivaling the modern Himalayas, while the vast Mirovia ocean covered the rest of the planet.

Temperature
18 °C
CO₂
~1,200–2,000 ppm
O₂
~5–10% of present level
Day length
19.4 hours
Sea level
High eustatic sea level

Key milestones

  1. Cratonic Collisions~1,200 Ma

    Amazonia, Baltica, and Australia collide with Laurentia along ancient sutures.

  2. Peak Grenville Orogeny~1,100 Ma

    Himalayan-height mountain belt sheds sediments into vast interior foreland basins.

  3. Midcontinent Rift Extension~1,080 Ma

    Mantle plume rifting nearly splits Laurentia, leaving massive basaltic copper lodes.

On the globe 4 pointers

  • Laurentia Cratonic Core

    15°S, 165°W

    The ancestral North American craton anchored at the geographical heart of Rodinia.

  • Grenville Orogenic Mountain Belt

    20°S, 145°W

    10,000-km-long collisional mountain chain formed by Amazonia slamming into Laurentia.

  • Mirovia Pan-Global Ocean

    25°N, 45°E

    The single world ocean surrounding Rodinia, teeming with photosynthetic acritarchs.

  • Baltica & Amazonia Cratons

    30°S, 175°W

    Colliding proto-continents welded to Laurentia along the Sveconorwegian front.

Theories and models

  • Supercontinent Cycle (Wilson Cycle)1966

    Continents cyclically assemble into supercontinents and break apart every 400–600 million years.

  • SWEAT Hypothesis1991

    Southwest US and East Antarctica were contiguous in Rodinia (Moores & Dalziel paleomagnetic fit).

  • Grenvillian Metamorphic Orogeny1989

    High-grade granulite-facies metamorphism documenting continent-continent Himalayan-scale collision.

Pioneers

  • Mark McMenamin

    Paleontologist (Mount Holyoke College, b. 1957)

    Coined the name "Rodinia" (from Russian rodina, motherland) in 1990 for the Neoproterozoic supercontinent.

  • J. Tuzo Wilson

    Canadian Geophysicist (Univ. of Toronto, 1908–1993)

    Pioneered plate tectonics, transform faults, and the cyclical supercontinent opening-closing cycle.

  • Christopher Scotese

    Paleogeographer (Northwestern / PALEOMAP Project)

    Mapped digital elevation models of ancient plate motions spanning the last 1.1 billion years.

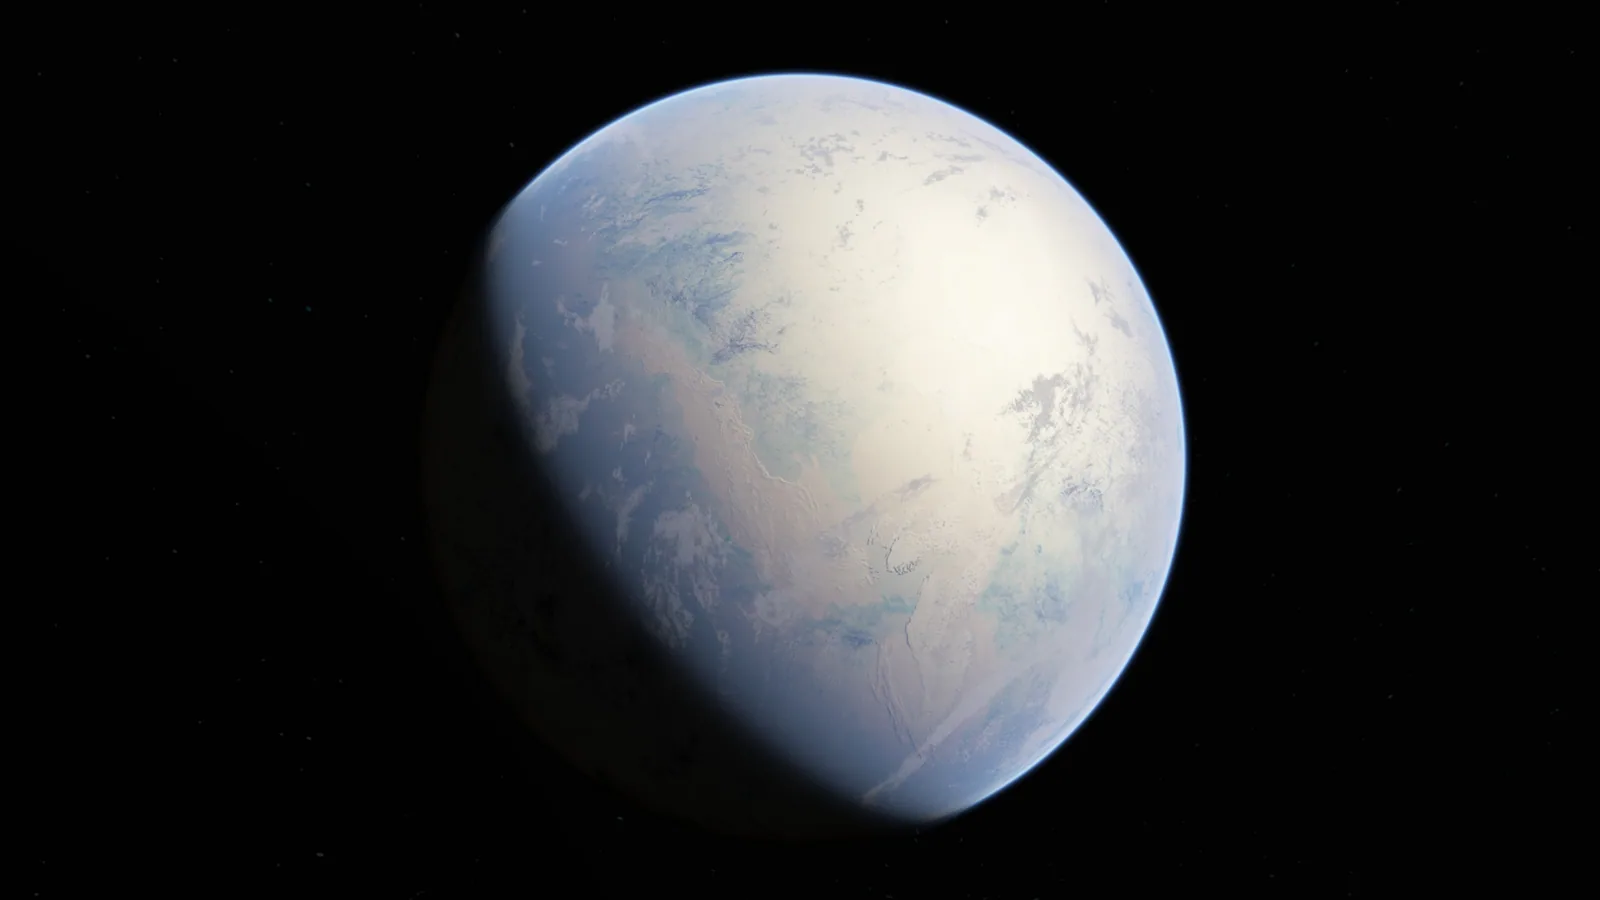
Artist rendering of Snowball Earth during the Cryogenian Sturtian glaciation (~717–660 Ma), when marine ice sheets extended all the way to the equator.
Era 5 of 12Cryogenian PeriodNeoproterozoic Eon

700 million years ago

Snowball Earth: The Cryogenian Cataclysm

Our globe · 700 million years agoThe reconstruction on this page, drawn from the plate model.

How did Earth freeze completely from pole to equator?

As Rodinia broke up into equatorial fragments, increased rainfall drew down carbon dioxide through rock weathering. With runaway ice-albedo feedback, glacial ice sheets marched across tropical oceans to the equator. Earth stayed frozen for over 50 million years until volcanic CO₂ triggered a super-greenhouse thaw.

Temperature
−45 °C to −10 °C
CO₂
100 ppm
O₂
~1–3% of present level
Day length
20.8 hours
Sea level
Frozen to depths of several hundred meters

Key milestones

  1. Tropical Weathering Drawdown~717 Ma

    Basaltic weathering of equatorial continents scrubs atmospheric CO₂ below critical threshold.

  2. The Sturtian Deep Freeze~717–660 Ma

    Earth freezes for 57 million years in the longest, most severe glaciation in history.

  3. Volcanic Super-Greenhouse Thaw~660 Ma

    Accumulated volcanic CO₂ breaches greenhouse tipping point; ice melts in an ultra-hothouse deluge.

On the globe 4 pointers

  • Equatorial Marine Ice Sheet

    0°N, 150°W

    Glacial shelf ice covering tropical latitudes as ocean surfaces froze hundreds of meters deep.

  • Rodinian Rifting Fissures

    10°S, 160°W

    Continental breakup rifts venting basaltic lava and greenhouse gases into the frozen world.

  • Cap Carbonate Deposition Zone

    25°N, 120°W

    Thick limestone layers precipitated rapidly from torrential acid rain during the post-freeze thaw.

  • Subglacial Hydrothermal Refugia

    35°S, 120°E

    Geothermal vents where early sponge-like multicellular organisms survived the frozen decades.

Theories and models

  • Runaway Ice-Albedo Feedback Model1969

    When sea ice advances past ~30° latitude, reflected solar radiation triggers irreversible cooling to the equator (Budyko).

  • Snowball Earth Hypothesis1992

    Kirschvink and Hoffman showed that equatorial glacial deposits in Namibia and Australia required total global glaciation.

  • Volcanic CO₂ Super-Greenhouse Exit1998

    Without liquid water weathering to scrub CO₂, volcanic outgassing accumulated 350× modern carbon dioxide.

Pioneers

  • Paul F. Hoffman

    Geologist (Harvard University, b. 1941)

    Provided comprehensive field evidence in Namibia demonstrating the Snowball Earth cycle and cap carbonates.

  • Joseph L. Kirschvink

    Geobiologist (Caltech, b. 1953)

    Coined the term "Snowball Earth" in 1992 and proved equatorial glaciation using paleomagnetic pole measurements.

  • W. Brian Harland

    Geologist (Cambridge, 1917–2003)

    First noted the worldwide occurrence of Neoproterozoic glacial tillites at low paleolatitudes in 1964.

Artist rendering of Snowball Earth during the Cryogenian Sturtian glaciation (~717–660 Ma), when marine ice sheets extended all the way to the equator. · NASA / Goddard Space Flight Center · Public Domain ↗

Era 6 of 12Cambrian PeriodPhanerozoic Eon

520 million years ago

The Cambrian Explosion of Complex Life

Photograph · the evidenceModel of Anomalocaris canadensis, the apex radiodont predator of the 500-million-year-old Cambrian seas, discovered in the Burgess Shale of British Columbia.Royal Ontario Museum / Wikimedia Commons · CC BY-SA 3.0 ↗
Our globe · 520 million years agoThe reconstruction on this page, drawn from the plate model.

How did animal body plans and biomineralization explode onto Earth?

In a geologically brief 20-million-year burst, almost every modern animal phylum appeared in the fossil record. Oceans surged with trilobites, mollusks, and apex predators like Anomalocaris, while the land remained barren rock under high atmospheric carbon dioxide.

Temperature
21 °C
CO₂
~4,500 ppm
O₂
~12–15% of atmosphere
Day length
21.4 hours
Sea level
+150 to +250 m above present

Key milestones

  1. Small Shelly Fauna Dawn~541 Ma

    First calcified skeletal tubes and spicules appear at the base of the Cambrian.

  2. Trilobite Radiation~521 Ma

    Arthropods with compound eyes and jointed exoskeletons colonize shallow marine shelves.

  3. Apex Predator Emergence~515 Ma

    One-meter-long Anomalocaris patrols the seas, establishing complex multi-tier trophic food webs.

On the globe 4 pointers

  • Gondwana Southern Supercontinent

    30°S, 140°W

    Immense southern landmass uniting Africa, South America, Antarctica, Australia, and India.

  • Burgess Shale Deep Seafloor

    15°N, 170°W

    Anoxic submarine mudslide that perfectly preserved soft-bodied Cambrian predators and oddities.

  • Iapetus Ocean

    10°N, 110°W

    Proto-Atlantic ocean separating Laurentia, Baltica, and Avalonia during the early Paleozoic.

  • Equatorial Laurentia

    5°N, 165°W

    Ancient North America lying horizontally across the warm equator with vast shallow epicontinental seas.

Theories and models

  • Cambrian Explosion Evolutionary Radiation1979

    Rapid cladogenesis of bilaterian animals with specialized tissues, sensory eyes, and digestive tracts.

  • Biomineralization & Arms Race Theory1989

    The advent of calcite and phosphate shells triggered an evolutionary predator-prey escalation.

  • Oceanic Oxygenation Threshold2014

    Marine dissolved oxygen crossed the energetic threshold needed to sustain predatory muscular motility.

Pioneers

  • Charles Doolittle Walcott

    Paleontologist (Smithsonian, 1850–1927)

    Discovered the world-famous Middle Cambrian Burgess Shale fossil bed in the Canadian Rockies in 1909.

  • Stephen Jay Gould

    Evolutionary Biologist (Harvard, 1941–2002)

    Authored Wonderful Life (1989), highlighting the bizarre disparate body plans of the Burgess fauna.

  • Simon Conway Morris

    Paleobiologist (Cambridge, b. 1951)

    Led the comprehensive anatomical re-examination of Burgess Shale fossils like Hallucigenia and Anomalocaris.

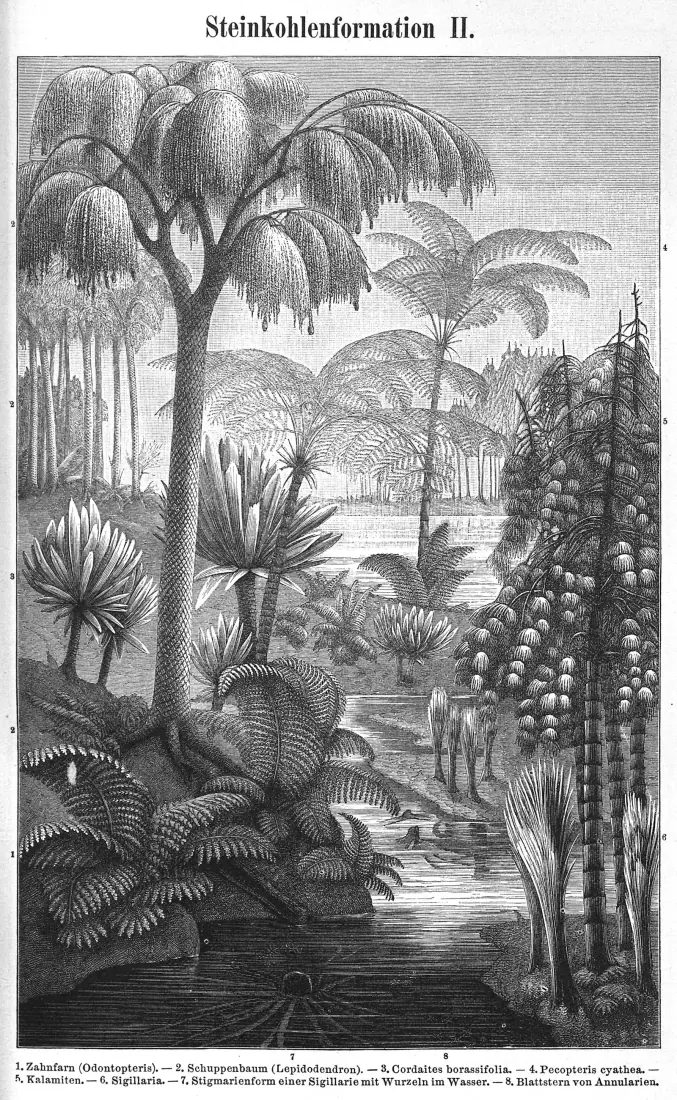
Carboniferous swamp forest reconstruction: towering Lepidodendron lycopsid trees and giant Calamites horsetails thrived in hyperoxic 35% oxygen air.
Era 7 of 12Carboniferous PeriodPhanerozoic Eon

300 million years ago

Carboniferous Coal Forests & Giant Insects

Our globe · 300 million years agoThe reconstruction on this page, drawn from the plate model.

Why did trees grow so tall and insects so huge 300 million years ago?

Vast coastal swamps of scale trees (Lepidodendron) covered the equator. Because fungi had not yet evolved enzymes to digest lignin, dead trees accumulated into miles of peat without decomposing, pumping atmospheric oxygen to a record 35% and fueling giant dragonflies with 70-cm wingspans.

Temperature
12 °C
CO₂
~350 ppm
O₂
35%
Day length
22.4 hours
Sea level
Fluctuating with Gondwanan ice sheets

Key milestones

  1. Lignin-Reinforced Plant Evolution~320 Ma

    Tree ferns and lycopsids grow 40 meters tall in vast swamp forests.

  2. Peak Atmospheric Hyperoxia~300 Ma

    Oxygen reaches 35%; colossal fires sweep through wetlands; giant arthropods dominate.

  3. Supercontinent Suturing~295 Ma

    Final docking of Gondwana and Laurussia completes the assembly of supercontinent Pangea.

On the globe 4 pointers

  • Tropical Coal Swamp Belt

    0°N, 30°W

    Vast equatorial wetlands where scale trees accumulated into future worldwide coal reserves.

  • Variscan-Alleghenian Mountains

    5°N, 10°W

    Colossal collisional mountain range raised as Gondwana collided with Euramerica.

  • Gondwanan Southern Ice Cap

    65°S, 30°E

    Continental ice sheets centered on the South Pole driving cyclical glacio-eustatic sea-level swings.

  • Panthalassa Superocean

    0°N, 150°E

    Global ocean spanning 70% of the planetary circumference, rich in sharks and ammonoids.

Theories and models

  • Atmospheric Hyperoxia & Insect Gigantism1998

    35% O₂ allowed simple tracheal diffusion to supply huge body masses, producing giant Meganeura and Arthropleura.

  • Lignin Burial Delay Hypothesis1990

    White rot fungi had not yet evolved lignocellulose-degrading peroxidases, trapping organic carbon in peat.

  • Cyclothem Deposition Theory1931

    Alternating coal, shale, and marine limestone beds driven by orbital Milankovitch cycles on Gondwanan glaciers.

Pioneers

  • Robert Berner

    Geochemist (Yale University, 1935–2015)

    Built the GEOCARB geochemical model calculating deep-time atmospheric oxygen and carbon dioxide levels.

  • Arthur Holmes

    Geologist (Durham University, 1890–1965)

    First proposed mantle thermal convection currents and pioneered radiometric dating of the Carboniferous.

  • Harold Urey

    Chemist (Chicago & UCSD, Nobel 1934)

    Pioneered oxygen isotope paleothermometry, unlocking deep-time ocean temperatures.

Carboniferous swamp forest reconstruction: towering Lepidodendron lycopsid trees and giant Calamites horsetails thrived in hyperoxic 35% oxygen air. · Field Museum of Natural History / Charles R. Knight · Public Domain ↗

Era 8 of 12End-Permian / Early TriassicPhanerozoic Eon

250 million years ago

Pangea & The Great Dying (End-Permian)

Map and data · the evidenceMollweide projection of supercontinent Pangea at 250 Ma, surrounded by the single global ocean Panthalassa and cradling the tropical Tethys Sea.Christopher Scotese (PALEOMAP Project) / USGS · CC BY 4.0 ↗
Our globe · 250 million years agoThe reconstruction on this page, drawn from the plate model.

What triggered the greatest mass extinction in Earth’s history?

Colossal flood basalt eruptions in the Siberian Traps pumped billions of tons of carbon dioxide, sulfur, and methane through coal deposits. Runaway global warming heated oceans to over 40 °C, starving them of oxygen and causing the Great Dying—eradicating 96% of marine species and 70% of land vertebrates.

Temperature
32 °C to 38 °C
CO₂
> 2,500–4,000 ppm
O₂
Plummeting from 30% to 15%
Day length
22.8 hours
Sea level
Low continental sea level

Key milestones

  1. Siberian Sill Intrusion251.9 Ma

    Basaltic magmas ignite Tunguska carbon deposits, releasing thousands of gigatons of greenhouse gases.

  2. Marine Ecosystem Collapse251.9–251.8 Ma

    Acidification and anoxia kill corals, trilobites, eurypterids, and blastoids in under 60,000 years.

  3. Triassic Thermal Recovery250–245 Ma

    Early Triassic "coal gap" and "reef gap" endure for 5 million years before life slowly diversifies.

On the globe 4 pointers

  • Pangea Supercontinent Core

    0°N, 0°E

    The continuous C-shaped landmass stretching from pole to pole with an arid, blistered interior.

  • Siberian Traps Magmatic Province

    60°N, 90°E

    2 million cubic kilometers of flood basalt lava erupting through volatile-rich coal basins.

  • Tropical Tethys Ocean Gulf

    10°N, 45°E

    Warm equatorial seaway cradled by Pangea, turned into an acidic, suffocating dead zone.

  • Panthalassa Superocean Anoxia

    0°N, 160°E

    Global ocean stripped of dissolved oxygen and poisoned with toxic hydrogen sulfide gas.

Theories and models

  • Siberian Traps Greenhouse Ignition1995

    Magma sills baking organic-rich Tunguska coal beds released colossal thermogenic methane and CO₂.

  • Ocean Anoxia & Hydrogen Sulfide Poisoning2005

    Lethal stratification allowed green sulfur bacteria to bloom, releasing toxic H₂S gas into the atmosphere.

  • Lethal Low-Latitude Thermal Threshold2012

    Equatorial ocean temperatures exceeded 40 °C, collapsing photosynthesis and complex food webs.

Pioneers

  • Alfred Wegener

    Meteorologist & Geophysicist (1880–1930)

    Formulated the continental drift hypothesis in 1912 and reconstructed supercontinent Pangea.

  • Douglas Erwin

    Paleobiologist (Smithsonian Institution, b. 1958)

    Authored The Great Paleozoic Crisis (1993), synthesizing the multi-causal mechanics of the End-Permian extinction.

  • Paul Renne

    Geochronologist (Berkeley Geochronology Center)

    Pinpointed the Siberian Traps eruption age to within 50,000 years of the mass extinction boundary.

Era 9 of 12Early JurassicPhanerozoic Eon

200 million years ago

The Breakup of Pangea & CAMP Rifting

Map and data · the evidenceBathymetric physiographic map of the Atlantic Ocean floor showing the mid-ocean spreading ridge where Pangea tore apart during the Jurassic.Marie Tharp & Bruce Heezen / Office of Naval Research / Library of Congress · Public Domain ↗
Our globe · 200 million years agoThe reconstruction on this page, drawn from the plate model.

How did Pangea split apart to create the Atlantic Ocean?

Massive mantle upwelling tore Pangea along ancient sutures, triggering the Central Atlantic Magmatic Province (CAMP)—the largest volcanic province in Earth’s history. As North America separated from Africa, seawater flooded the expanding rift, birthing the Atlantic Ocean and setting the stage for the age of giant dinosaurs.

Temperature
20 °C
CO₂
~2,000 ppm
O₂
~16–18%
Day length
23.0 hours
Sea level
Rising with seafloor spreading ridges

Key milestones

  1. CAMP Basalt Outpourings201.5 Ma

    Four pulses of tholeiitic flood basalts cover 11 million km² across four modern continents.

  2. End-Triassic Mass Extinction201.3 Ma

    Crurotarsan archosaurs and therapsids go extinct; dinosaurs survive to take over terrestrial ecosystems.

  3. Atlantic Marine Transgression195 Ma

    Seawater permanently connects the Caribbean and Tethys, completing continental separation.

On the globe 4 pointers

  • Central Atlantic Rift (CAMP)

    15°N, 20°W

    Volcanic rift zone where magma tore North America away from Northwest Africa.

  • Proto-North Atlantic Seaway

    25°N, 35°W

    Shallow marine ingress filling the widening continental rift with thick evaporite salt beds.

  • Laurasia Northern Landmass

    40°N, 10°W

    Northern fragment of Pangea comprising North America, Europe, and Asia.

  • Tethys Spreading Ridge

    20°N, 60°E

    Active mid-ocean ridge pushing Gondwana southward and isolating early dinosaur lineages.

Theories and models

  • Seafloor Spreading & Continental Rifting1962

    Harry Hess proposed that new oceanic crust forms at spreading ridges, driving continental drift.

  • CAMP End-Triassic Extinction Trigger1999

    Carbon and sulfur pulses from CAMP basalts caused the End-Triassic mass extinction, clearing rivals for dinosaurs.

  • Wilson Cycle Continental Fragmentation1966

    Supercontinents act as thermal blankets, trapping mantle heat until rifting tears them apart.

Pioneers

  • Marie Tharp

    Oceanographic Cartographer (Columbia Univ., 1920–2006)

    Discovered the central rift valley of the Mid-Atlantic Ridge in 1952, proving seafloor spreading and plate tectonics.

  • Harry Hess

    Geologist & US Navy Rear Admiral (Princeton, 1906–1969)

    Published "History of Ocean Basins" in 1962, formulating the theory of seafloor spreading.

  • Paul Olsen

    Paleontologist (Columbia University, b. 1953)

    Drilled Newark Basin rift strata, establishing the precise astronomical timescale of CAMP rifting.

Era 10 of 12Cretaceous–Paleogene (K-Pg)Phanerozoic Eon

66 million years ago

The Chicxulub Asteroid Impact & K-Pg Extinction

Map and data · the evidenceGravity anomaly map of the 180-km Chicxulub asteroid impact structure on Mexico’s Yucatán Peninsula, marking the site of the dinosaur mass extinction 66 Ma.NASA / JPL / Lunar and Planetary Institute / Mark Pilkington · Public Domain ↗
Our globe · 66 million years agoThe reconstruction on this page, drawn from the plate model.

How did a 10-km asteroid end the reign of the non-avian dinosaurs?

A 10-km asteroid slammed into the shallow seas of the Yucatán Peninsula at 20 km/s with the explosive energy of 100 million megatons. The impact excavated a 180-km crater, spawned 100-meter tsunamis, ignited global wildfires with re-entering ejecta, and blocked the Sun with sulfate aerosols, extinguishing 75% of species.

Temperature
22 °C
CO₂
~1,000 ppm
O₂
~23–25%
Day length
23.5 hours
Sea level
+75 m above present

Key milestones

  1. Bolide Atmospheric Penetrationt = 0 seconds

    10-km asteroid punches through the atmosphere at 20 km/s, compressing air to 10,000 °C.

  2. Transient Crater & Peak Ring Collapset = 5 minutes

    100-km-wide, 30-km-deep transient cavity rebounds; molten granite peak ring freezes in place.

  3. Ballistic Re-entry Firestormt = 2–6 hours

    Trillions of glassy microtektites re-enter the upper atmosphere, heating the ground like a broiling oven.

On the globe 4 pointers

  • Chicxulub Impact Crater

    21°N, 89°W

    180-km multi-ring impact basin centered on the Yucatán coast, buried beneath 1 km of limestone.

  • Western Interior Seaway

    42°N, 98°W

    Vast shallow inland ocean splitting North America into Laramidia and Appalachia.

  • Deccan Traps Volcanic Province

    18°N, 73°E

    Massive flood basalt volcanism in ancient India stressing global ecosystems prior to the impact.

  • Radial Mega-Tsunami Wavefront

    26°N, 75°W

    Initial 100–300-meter-tall tsunamis radiating across the Gulf of Mexico and proto-Atlantic.

Theories and models

  • Alvarez Asteroid Impact Hypothesis1980

    Worldwide clay layer enriched in extraterrestrial iridium (Ir) proves a 10-km bolide impact caused the K-Pg extinction.

  • Impact Winter & Photosynthesis Shutdown1982

    Sub-micron soot from wildfires and sulfate aerosols from anhydrite vaporization blocked sunlight for years.

  • Deccan Traps Seismic Triggering2015

    Antipodal seismic focus from the Chicxulub shockwave accelerated the Deccan Traps volcanic eruption rate.

Pioneers

  • Luis Alvarez & Walter Alvarez

    Nobel Physicist & Geologist (UC Berkeley)

    Discovered the global iridium anomaly in Gubbio, Italy, proving the asteroid impact in 1980.

  • Jan Smit

    Paleontologist (Vrije Universiteit Amsterdam)

    Independently discovered the iridium anomaly and impact spherules in Caravaca, Spain.

  • Joanna Morgan & Sean Gulick

    Geophysicists (Imperial College & UT Austin)

    Led IODP Expedition 364 drilling the Chicxulub peak ring in 2016, proving dynamic crustal rebound.

Era 11 of 12Early EoceneCenozoic (Paleogene)

50 million years ago

The Early Eocene Hothouse & Mountain Building

Map and data · the evidencePaleogeographic elevation reconstruction of Earth at 50 Ma during the early Eocene hothouse, when palm trees and alligators flourished above the Arctic Circle.Christopher Scotese / PALEOMAP Project · CC BY 4.0 ↗
Our globe · 50 million years agoThe reconstruction on this page, drawn from the plate model.

Why did palm trees and alligators live in the Arctic 50 million years ago?

During the Eocene, atmospheric carbon dioxide surged above 1,500 ppm, turning Earth into a lush hothouse without a trace of polar ice. Concurrently, the Indian subcontinent slammed into Eurasia at 15 cm per year, buckling the crust and commencing the immense uplift of the Himalayas.

Temperature
26 °C to 28 °C
CO₂
~1,500–2,000 ppm
O₂
~21–22%
Day length
23.8 hours
Sea level
+70 m above present

Key milestones

  1. PETM Hyperthermal Pulse55.8 Ma

    5,000 gigatons of carbon enter the atmosphere; global temperatures spike by 5–8 °C in 20,000 years.

  2. Hard Continental Collision50 Ma

    India welds into Eurasia; ocean crust subduction ends and massive mountain uplift begins.

  3. Azolla Bloom Carbon Drawdown49 Ma

    Arctic fern blooms bury organic carbon over 800,000 years, reversing the hothouse into a cooling trend.

On the globe 4 pointers

  • India–Eurasia Collision Suture

    28°N, 85°E

    Fast-moving Indian plate smashing into Asia, commencing the Himalayan-Tibetan orogenic uplift.

  • Arctic Freshwater Azolla Sea

    85°N, 0°E

    Warm, ice-free polar ocean carpeted by Azolla floating ferns that sequestered trillions of tons of carbon.

  • Drake Passage Continental Barrier

    58°S, 65°W

    Land bridge connecting South America and Antarctica, preventing the circumpolar ocean current.

  • Warm Antarctic Coastal Forests

    70°S, 90°E

    Nothofagus beech forests and lush vegetation thriving along the ice-free Antarctic margin.

Theories and models

  • Paleocene-Eocene Thermal Maximum (PETM)1991

    Massive carbon isotope excursion (CIE) driven by seafloor methane clathrate destabilization.

  • Azolla Event Carbon Drawdown2006

    Proliferation of freshwater Azolla ferns in the landlocked Arctic Ocean drew CO₂ down from 3,500 to 650 ppm.

  • India Continental Indentation Mechanics1975

    Molnar & Tapponnier model showing lithospheric extrusion and crustal thickening building Tibet.

Pioneers

  • James Kennett & Lowell Stott

    Paleoceanographers (UCSB & USC)

    Discovered the profound carbon and oxygen isotope shift of the PETM in Weddell Sea sediment cores in 1991.

  • Henk Brinkhuis

    Paleoclimatologist (Utrecht University)

    Discovered the Azolla Event in 2004 Arctic Coring Expedition (ACEX) sediments.

  • Peter Molnar

    Geophysicist (MIT & Univ. of Colorado, 1943–2022)

    Pioneered the quantitative geodynamics of the India-Asia collision and its effect on global monsoons.

Era 12 of 12Late PleistoceneQuaternary Period

20,000 years ago

The Last Glacial Maximum (Ice Age)

Map and data · the evidenceCLIMAP global sea surface temperature and continental ice sheet reconstruction at the Last Glacial Maximum 20,000 years ago, when sea level was 124 meters lower.NOAA Paleoclimatology / CLIMAP Project / Lamont-Doherty · Public Domain ↗
Our globe · 20,000 years agoThe reconstruction on this page, drawn from the plate model.

How much of Earth was buried under ice during the last ice age?

At the Last Glacial Maximum, ice sheets up to 3 kilometers thick buried Canada, the northern US, and northern Europe. So much water was trapped in ice that sea levels plummeted 124 meters, exposing fertile land bridges like Doggerland across the North Sea and Beringia connecting Asia to the Americas.

Temperature
8.5 °C
CO₂
180–190 ppm
O₂
20.9%
Day length
24.0 hours
Sea level
−124 m below modern coastlines

Key milestones

  1. Peak Ice Sheet Advance21,000–19,000 BP

    Global ice volume peaks; sea levels reach −124 meters below present.

  2. Meltwater Pulse 1A14,600 BP

    Catastrophic ice sheet collapse drives sea level upward by 16 meters in under 400 years.

  3. Holocene Climatic Optimum11,700 BP to present

    Modern interglacial warmth stabilizes, enabling agriculture and human civilization.

On the globe 4 pointers

  • Laurentide Ice Sheet

    55°N, 85°W

    Colossal 3-km-thick continental glacier covering Canada and reaching south to modern New York and Chicago.

  • Fennoscandian Ice Sheet

    62°N, 18°E

    Vast ice cap burying Scandinavia, the Baltic, and Scotland under mountains of ice.

  • Exposed Doggerland Shelf

    54°N, 2°E

    Fertile low-lying plain connecting Great Britain directly to mainland Europe across the drained North Sea.

  • Beringia Land Bridge

    64°N, 170°W

    1,000-km-wide grassland corridor connecting Siberia to Alaska, traversed by mammoths and humans.

Theories and models

  • Milankovitch Astronomical Glacial Cycles1941

    Variations in orbital eccentricity (100 kyr), axial tilt (41 kyr), and precession (23 kyr) control summer insolation.

  • Dust-Iron Ocean Fertilization Hypothesis1990

    Arid glacial winds carried iron-rich dust into the Southern Ocean, stimulating phytoplankton carbon drawdown.

  • Heinrich & Dansgaard-Oeschger Rapid Cycles1988

    Massive armada-like armadas of icebergs calved into the North Atlantic, causing abrupt millennial climate flips.

Pioneers

  • Milutin Milanković

    Serbian Mathematician & Astronomer (1879–1958)

    Calculated the mathematical curves of solar insolation that proved astronomical orbital pacing of ice ages.

  • Louis Agassiz

    Glaciologist (1807–1873)

    First proposed the Ice Age concept in 1837 based on glacial erratics and moraines across Europe.

  • Wallace Broecker

    Geochemist (Columbia University, 1931–2019)

    Coined "The Great Ocean Conveyor" (AMOC) and linked thermohaline circulation shutdowns to abrupt climate changes.

The Big Bang in 3D →13.8 billion years ago to the birth of the Sun, in eight animated scenes.How Earth formed →From dust to the Moon and the first oceans, in nine animated scenes.

Moments in Earth’s history

  • Earth 4.5 Billion Years Ago · Magma Ocean & the New Moon

    What Earth was like 4.5 billion years ago: a molten world just struck by the Mars-sized Theia, with a newly formed Moon only a few Earth-widths away.

  • Earth 4 Billion Years Ago · The Hadean Ends

    Earth 4 billion years ago: a water world under a hazy sky, still pelted by asteroids, at the end of the Hadean. The oldest rocks we can still visit date from now.

  • Earth 3.5 Billion Years Ago · The First Life

    Earth 3.5 billion years ago: the oldest accepted fossils, mounds built by microbes, under an orange methane haze with almost no oxygen in the air.

  • Earth 2.4 Billion Years Ago · The Great Oxidation Event

    Earth 2.4 billion years ago: oxygen from microbes floods the air in the Great Oxidation Event, the methane haze clears and ice sheets reach low latitudes.

  • Earth 2 Billion Years Ago · Vredefort & Columbia

    Earth 2 billion years ago: the Vredefort asteroid strikes South Africa, continents collide to form the supercontinent Columbia, and the sky is blue.

  • Earth 1 Billion Years Ago · Rodinia Map

    What Earth looked like 1 billion years ago: the supercontinent Rodinia, with North America at its heart, on a world of bare rock and microbial life.

  • Earth 750 Million Years Ago · Rodinia Breaks Up

    Earth 750 million years ago: the supercontinent Rodinia splits as the Pacific Ocean is born, just before the Snowball Earth glaciations.

  • Earth 650 Million Years Ago · Snowball Earth

    Earth 650 million years ago: ice covers the planet almost from pole to pole in the Marinoan glaciation, the second Snowball Earth of the Cryogenian.

  • Earth 600 Million Years Ago · The Ediacaran

    Earth 600 million years ago in the Ediacaran: the Snowball Earths are over, oxygen is rising and the first large animals are about to appear.

  • Earth 540 Million Years Ago · Cambrian Map

    What Earth looked like 540 million years ago at the start of the Cambrian: Gondwana in the south, bare land and seas about to fill with animals.

  • Earth 500 Million Years Ago · Cambrian World Map

    What Earth looked like 500 million years ago: warm shallow seas full of trilobites, bare continents and Gondwana spread across the south.

  • Earth 450 Million Years Ago · Ordovician Map

    Earth 450 million years ago in the Ordovician: rich seas, the first plants on land, and Gondwana drifting over the South Pole towards an ice age.

  • Earth 400 Million Years Ago · Devonian Map

    What Earth looked like 400 million years ago in the Devonian: the Age of Fishes, the first insects, and plants spreading over the land.

  • Earth 350 Million Years Ago · Carboniferous Map

    Earth 350 million years ago: four-legged animals on land, the first forests spreading and Gondwana closing in on Laurussia to build Pangea.

  • Earth 300 Million Years Ago · Coal Forests & Ice Age

    What Earth looked like 300 million years ago: tropical coal swamps, giant insects, ice sheets over southern Gondwana and Pangea almost complete.

  • Earth 250 Million Years Ago · Pangea Map

    What Earth looked like 250 million years ago: a 3D globe of Pangea, the single supercontinent, just after the Great Dying wiped out about 90% of sea life.

  • Earth 200 Million Years Ago · Pangea Breaks Up

    What Earth looked like 200 million years ago: Pangea splitting as the Atlantic is born, lava floods, and the extinction that let dinosaurs take over.

  • Earth 150 Million Years Ago · Jurassic Map

    What Earth looked like 150 million years ago in the Late Jurassic: giant sauropods, Archaeopteryx and a young, narrow Atlantic Ocean.

  • Earth 100 Million Years Ago · Cretaceous Map

    What Earth looked like 100 million years ago: a hot Cretaceous world with high seas, flowering plants and a seaway splitting North America.

  • Earth 66 Million Years Ago · When the Dinosaurs Died

    Earth 66 million years ago on a 3D globe: where the continents were when the Chicxulub asteroid hit, and an animation of the impact, tsunami and impact winter.

  • Earth 50 Million Years Ago · Eocene Map

    What Earth looked like 50 million years ago: the warmest climate of the last 66 million years, forests near the poles and India colliding with Asia.

  • Earth 35 Million Years Ago · Eocene–Oligocene Map

    Earth 35 million years ago: two asteroid impacts, a cooling climate and Antarctica about to freeze over at the end of the Eocene.

  • Earth 20 Million Years Ago · Miocene Map

    What Earth looked like 20 million years ago in the Miocene: grasslands spreading, apes in Africa and Arabia joining Asia.

  • Earth 5 Million Years Ago · Pliocene Map

    Earth 5 million years ago: the Mediterranean has just refilled, the Americas are almost joined and early human relatives walk in Africa.

  • Earth 20,000 Years Ago · Ice Age Map

    Ice age map of Earth 20,000 years ago: ice sheets over Canada and Europe, a sea 120 m lower and land bridges from Britain to Europe and Asia to America.

Events on the globe

  • Theia hits Earth · 4.51 billion years ago · The whole planet (position illustrative)

    A Mars-sized protoplanet struck the young Earth. The debris thrown into orbit gathered into the Moon, and Earth’s surface melted into a magma ocean.

  • The oldest crystals · 4.4 billion years ago · Jack Hills, Western Australia (position illustrative)

    Zircon crystals 4.4 billion years old carry chemical traces of liquid water, so oceans formed soon after Earth did.

  • The first life · 3.8 billion years ago · Deep-sea vents (position illustrative)

    Life may have begun around hot springs on the sea floor, where minerals and energy were on hand. Its oldest generally accepted traces are about 3.5 billion years old.

  • Stromatolites · 3.48 billion years ago · Pilbara, Western Australia (position illustrative)

    Layered mounds built by mats of microbes, 3.48 billion years old: among the oldest accepted signs of life on Earth.

  • The Great Oxidation Event · 2.4 billion years ago · The whole planet

    Cyanobacteria had been making oxygen for hundreds of millions of years; around 2.4 billion years ago it finally built up in the air, changing the planet’s chemistry for good.

  • Vredefort impact · 2.02 billion years ago · South Africa (position illustrative)

    The largest verified impact structure on Earth, once about 250–300 km across, made by an asteroid around 10–15 km wide 2.02 billion years ago.

  • Rodinia · 1 billion years ago · North America at its heart

    The Grenville mountain-building, whose roots run from Texas to Labrador and Scotland, records the collisions that built Rodinia.

  • Snowball Earth · 700 million years ago · Flinders Ranges, Australia

    Glacial rocks laid down near the equator, now in Australia and elsewhere, show ice reached the tropics twice, about 717–660 and 650–635 million years ago.

  • Ediacara fossils · 555 million years ago · Ediacara Hills, Australia

    Imprints of soft-bodied animals such as Dickinsonia, now known to be an animal from the fats preserved in it.

  • Chengjiang fossils · 518 million years ago · Yunnan, China

    Soft-bodied animals preserved in fine mud, including some of the earliest relatives of vertebrates: a snapshot of the Cambrian explosion.

  • Burgess Shale · 508 million years ago · British Columbia, Canada

    A Cambrian sea floor with strange animals such as five-eyed Opabinia and the predator Anomalocaris, then near the equator.

  • Ice sheet over the Sahara · 445 million years ago · North Africa

    Scratched rock and glacial deposits in the Sahara show that ice covered North Africa when it lay over the South Pole. The cold and falling seas killed about 85% of marine species.

  • Gilboa fossil forest · 385 million years ago · New York, USA

    Stumps of some of the earliest known trees, about 8 m tall, which had fronds instead of leaves.

  • Coal swamp forests · 300 million years ago · Joggins, Nova Scotia, Canada

    Tree-sized club mosses and horsetails grew in tropical swamps; their buried remains became the coal of Europe and North America. The first reptiles have been found in hollow stumps here.

  • Pangea comes together · 300 million years ago · Appalachians, Atlas and Variscan mountains

    Gondwana collided with Laurussia, raising a mountain range as tall as the Himalaya along the join. Its worn-down roots are the Appalachians, the Atlas and the hills of Europe.

  • The Great Dying · 252 million years ago · Siberian Traps, Russia

    Volcanic eruptions in Siberia released vast amounts of CO2, heating the planet and suffocating the oceans. About 90% of marine species died.

  • Some of the first dinosaurs · 231 million years ago · Ischigualasto, Argentina

    Eoraptor and Herrerasaurus, among the oldest known dinosaurs, lived here in a seasonal river valley.

  • Manicouagan impact · 214 million years ago · Quebec, Canada

    An asteroid about 5 km across left a crater about 100 km wide, now a ring-shaped lake visible from space.

  • Central Atlantic lava floods · 201 million years ago · Morocco and eastern North America

    As Pangea rifted, lava erupted over millions of km² (the Central Atlantic Magmatic Province), driving the end-Triassic mass extinction.

  • Deccan Traps eruptions · 66.2 million years ago · Western India

    Lava flows over a million km² thick erupted in India around the time of the impact, adding to the climate shock.

  • Chicxulub asteroid impact · 66 million years ago · Yucatán Peninsula, Mexico

    A ~10 km asteroid hit at ~20 km/s, making a 180 km crater, a global tsunami and an impact winter. About 75% of species, including the non-bird dinosaurs, died out.

  • India meets Asia · 50 million years ago · Himalaya and Tibet

    The collision is still going on: India pushes north about 4–5 cm a year, raising the Himalaya and causing earthquakes across Asia.

  • Popigai impact · 35.7 million years ago · Siberia, Russia

    A 100 km crater whose shocked rocks contain diamonds. Chesapeake Bay was struck within about a million years of it.

  • Antarctica freezes over · 34 million years ago · Antarctica

    At the Eocene–Oligocene boundary the first lasting ice sheet formed on Antarctica, as CO2 fell and ocean gateways opened around it.

  • The Mediterranean dries out · 5.6 million years ago · Strait of Gibraltar

    When the Atlantic connection closed, the Mediterranean evaporated and left salt over 1 km thick. About 5.33 million years ago the Atlantic broke back in.

  • Panama closes · 2.8 million years ago · Isthmus of Panama

    The land bridge joined North and South America, let animals cross between them and rerouted ocean currents.

  • Doggerland · 20,000 years ago · North Sea

    Low sea levels exposed a land of hills and marshes between Britain and Europe, where people hunted until rising seas drowned it about 8,000 years ago.

  • The Bering land bridge · 20,000 years ago · Bering Strait

    A land bridge up to 1,000 km wide joined Siberia and Alaska; people crossed it into the Americas.

Landforms on the globe

On today’s globe, the diamond tags mark famous examples of each landform. Tap one to watch it form in a 3D cut-away diagram; the Himalaya, the Atlantic, the Red Sea and the Appalachians can also be watched forming over millions of years on the globe itself.

Quick Answers

What did Earth look like 250 million years ago?
Almost all land was joined in one supercontinent, Pangea, shaped like a giant “C” around the Tethys Ocean, with a single world ocean, Panthalassa, covering the rest of the planet. There were no polar ice caps and the interior of Pangea was hot and dry.
Where did the asteroid that killed the dinosaurs hit?
In a shallow sea at the edge of what is now the Yucatán Peninsula in Mexico, 66 million years ago. The buried Chicxulub crater is about 180 km wide. The globe shows the site where it was at the time, a few degrees from its position today, because North America has since moved.
How do scientists know where the continents were in the past?
From the magnetism frozen into ancient rocks (which records their latitude), the ages and magnetic stripes of the sea floor, matching rocks and fossils on continents now far apart, and the traces of old mountain belts where continents collided. Plate models such as PALEOMAP combine this evidence into maps for every few million years.
Was the Earth hotter in the past?
For most of the last 540 million years, yes. Average temperatures were often 5 to 15 °C above today’s, with no permanent ice at the poles. Cold spells with ice ages, like the one we live in now, were the exception: the late Ordovician, the late Carboniferous and Permian, and the last 34 million years.
Why was a day shorter in the past?
The Moon’s tides act as a brake on Earth’s spin, slowly lengthening the day while the Moon drifts away (about 3.8 cm a year today). Growth bands in fossil corals and clams show that a year had about 400 days in the Devonian and 372 days at the end of the Cretaceous.

Where the maps come from

The ancient maps are the PALEOMAP Paleodigital Elevation Models by Christopher Scotese and Nicky Wright (2018), which estimate land height and ocean depth every 5 million years (doi:10.5281/zenodo.5460860, CC BY 4.0). Temperature, CO₂ and sea level come from the PALEOMAP climate tables of Scotese and colleagues (2021, 2024;doi:10.5281/zenodo.10659112, CC BY 4.0), and the temperature and rainfall maps from their gridded models for each map (doi:10.5281/zenodo.5718392and the same PALEOMAP record). Deserts, forests and ice on the globe follow that rainfall and temperature. The ice sheets and lower seas of the last 80,000 years are PaleoMIST 1.0 by Evan Gowan and colleagues (doi:10.1594/PANGAEA.905800, CC BY 4.0). The climate zones are our simplification from yearly temperature and rainfall, not a Köppen classification.

Continents move between the maps with the rotations of the PALEOMAP plate model, which the maps were built on; today’s coastlines (Natural Earth, public domain) are carried by the same rotations. No map of the land exists before about 540 million years ago: from 560 million to 1.1 billion years ago the globe carries the continents of 540 million years ago back with those rotations (their shapes are therefore approximate), and before that it is an illustration of the magma ocean, the first oceans, the orange Archean sky, the Great Oxidation Event and the Snowball Earths, and says so on screen. Event sites are moved to their ancient positions with the PALEOMAP plate model. The tsunami in the Chicxulub animation follows a simple wave-speed model run on the sea floor of the 66-million-year map; the animations are illustrations, not simulations.