
Sea Level Rise Map
Move the sea and watch the coastlines change, on a flat map or a 3D globe. Bring back the Ice Age, try the IPCC’s projections for 2100, or melt all the ice on Earth. Tap anywhere for the height of the ground.
FloodedSea bed laid bareBelow sea level, held dryDry basin
Named sea levels
Press one to set the map to it. The map opens with all the ice melted, because smaller rises are hard to see on a world map. Zoom in to a coast for those.
The past
Ice sheets held so much water that Britain joined Europe across Doggerland and Asia joined Alaska across Beringia. (PaleoMIST, −124 m.)
IPCC projections
Median rise compared with 1995–2014
IPCC AR6 median under SSP2-4.5, compared with 1995–2014.
IPCC AR6 median under SSP1-2.6, compared with 1995–2014.
IPCC AR6 median under SSP2-4.5, compared with 1995–2014.
IPCC AR6 median under SSP5-8.5, compared with 1995–2014.
IPCC AR6 median under SSP5-8.5, compared with 1995–2014.
If the ice melted
Greenland holds 7.42 m of sea level (BedMachine). A full melt would take many centuries.
Greenland, Antarctica and every glacier together: about 65.6 m. Not a forecast for any century soon.
Thought experiments
A thought experiment: the ocean at the height of the Dead Sea’s shore, the lowest dry land on Earth.
A thought experiment: almost every ocean floor laid bare, down to the Mariana Trench.
A thought experiment: nothing on Earth stays above the water.
How much will the sea rise?
Global sea level rose about 0.20 m between 1901 and 2018, and it is speeding up. These are the IPCC’s central estimates for what comes next, with the likely range in brackets, in metres compared with 1995–2014.
| Emissions | 2050 | 2100 | 2150 |
|---|---|---|---|
| Very low emissions SSP1-1.9 | 0.18 m (0.15–0.23) | 0.38 m (0.28–0.55) | 0.58 m (0.37–0.86) |
| Low emissions SSP1-2.6 | 0.19 m (0.16–0.25) | 0.44 m (0.32–0.61) | 0.68 m (0.46–1.01) |
| Middle emissions SSP2-4.5 | 0.20 m (0.17–0.26) | 0.56 m (0.43–0.76) | 0.93 m (0.66–1.33) |
| High emissions SSP3-7.0 | 0.21 m (0.18–0.27) | 0.68 m (0.55–0.90) | 1.20 m (0.89–1.64) |
| Very high emissions SSP5-8.5 | 0.23 m (0.20–0.29) | 0.77 m (0.62–1.02) | 1.33 m (0.98–1.89) |
These are medium-confidence figures. Ice-sheet processes that are not well understood could add more: with them, the likely range under very high emissions runs from 0.62 m to 1.61 m by 2100. The rise at any one coast will differ from the global figure, because land moves and the ocean does not rise evenly.
Data: Garner, G. G., et al. (2021), IPCC AR6 Sea Level Projections, version 20210809, CC BY 4.0. Fox-Kemper, B., et al. (2021), Ocean, Cryosphere and Sea Level Change, IPCC AR6 WGI Chapter 9. Kopp, R. E., et al. (2023), the FACTS framework, Geoscientific Model Development. The 1901–2018 figure is from the AR6 WGI Summary for Policymakers.
Which coasts flood first? One, two and five metres
How soon a place floods comes down to how high its ground is. For each of three round levels, here are the places the sources name, and the earliest the IPCC’s projections reach that level. Press a button to see the map at that level.
+1 m
River deltas go first: broad, flat, farmed and crowded.
- Central estimate
- High emissions by 2150; very high emissions by 2150.
- Top of the likely range
- Low emissions by 2150; middle emissions by 2150; high emissions by 2150; very high emissions by 2100.
- If poorly understood ice-sheet processes matter
- Low emissions by 2150; middle emissions by 2150; very high emissions by 2100.
 +1 m
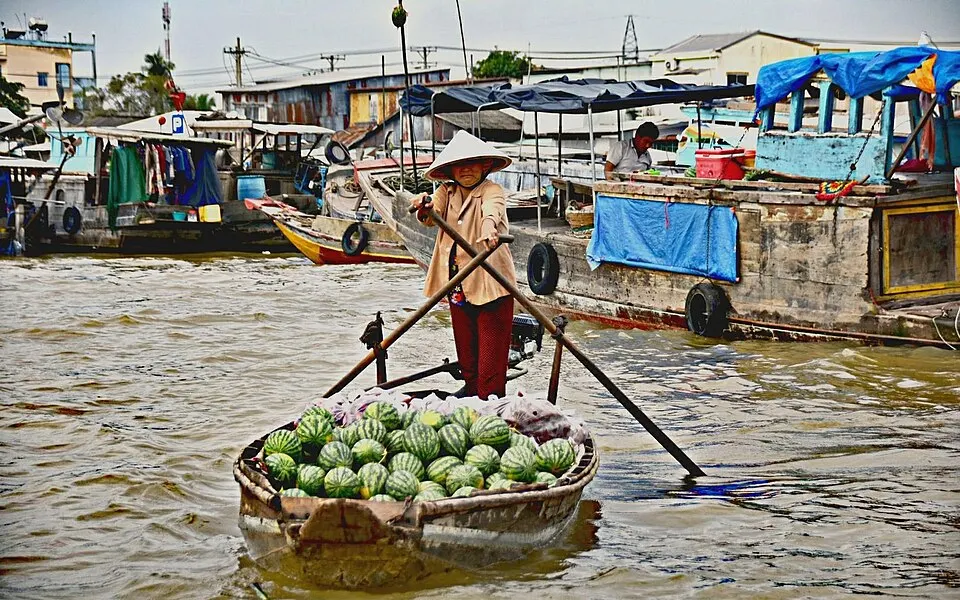
Mekong Delta
A 2019 study in Nature Communications found the delta’s ground averages only 0.82 m above sea level, with 75% of it below 1 m. About 12 million people live there.
The floating market at Cần Thơ, in the Mekong Delta. Photo: Peter Addor · CC BY 2.0 · Wikimedia Commons · Wikipedia: Mekong Delta
 +1 m
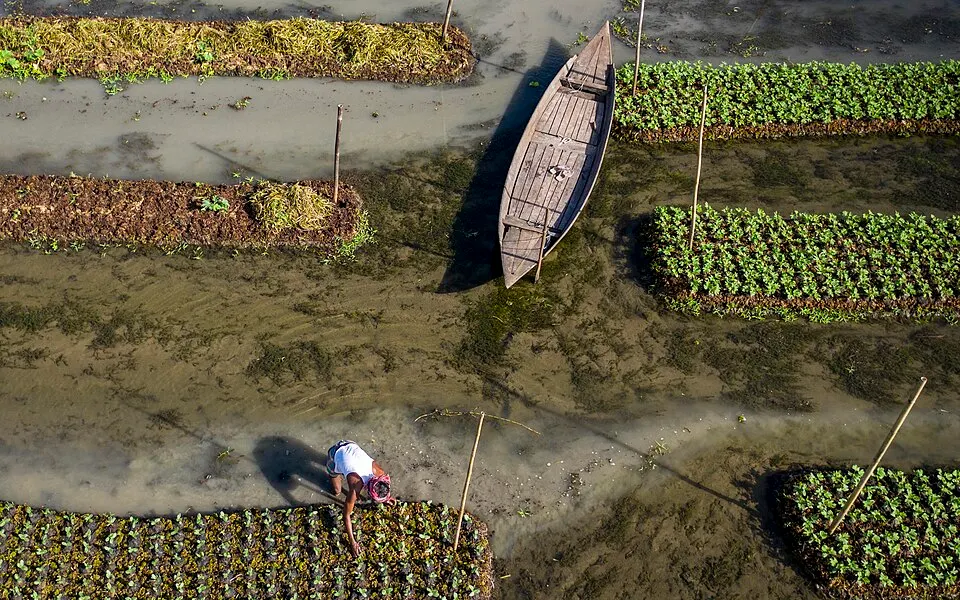
Bangladesh
An estimated 10% of the country’s land would flood.
A floating vegetable garden in Barisal, Bangladesh. Farmers grow crops on rafts that rise with the water. Photo: Azimronnie · CC BY-SA 4.0 · Wikimedia Commons · Wikipedia: Bangladesh
 +1 m
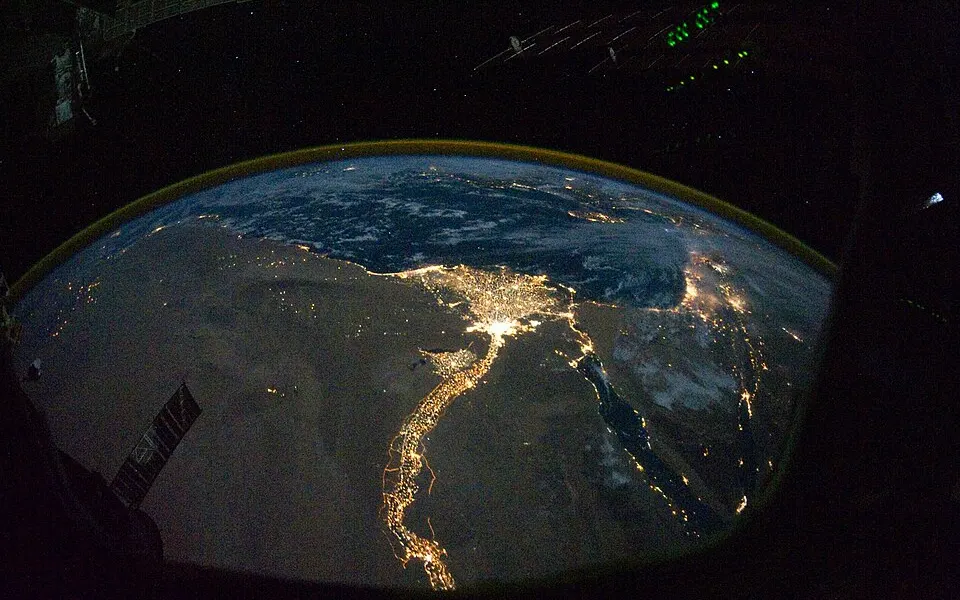
The Nile Delta
One estimate puts about 887,000 people at risk and about 450 square kilometres under water.
The Nile Delta at night from the International Space Station. Each cluster of light is a town or city. Photo: ISS Expedition 25 crew · Public domain · Wikimedia Commons · Wikipedia: Nile Delta
 +1 m
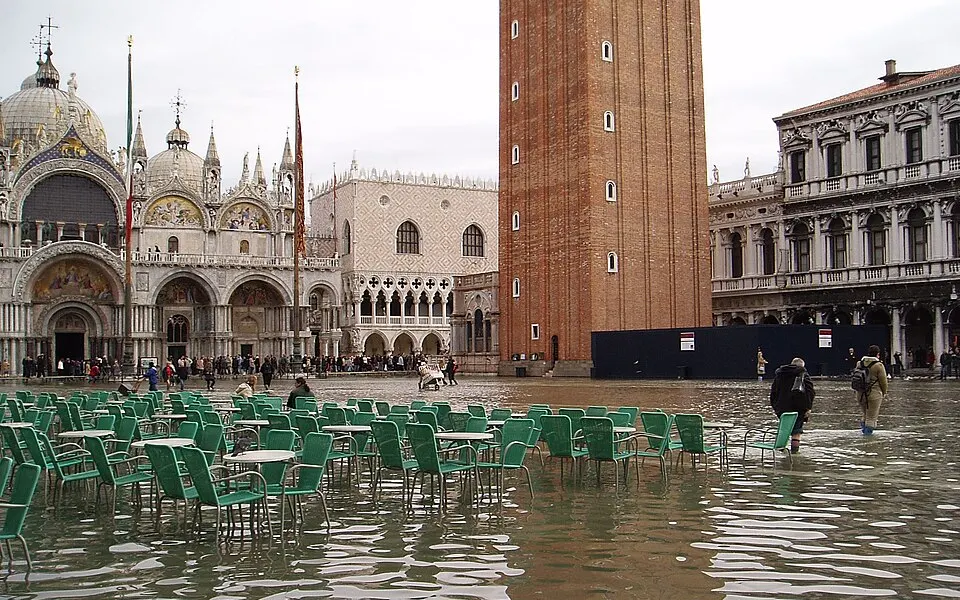
Venice
The lowest part of the city, around St Mark’s Basilica, is only 64 cm above sea level.
Piazza San Marco under water during an acqua alta in November 2004. Photo: Wolfgang Moroder · CC BY-SA 3.0 · Wikimedia Commons · Wikipedia: Venice
+2 m
Coral atolls and low port cities.
- Central estimate
- Not reached by 2150 under any scenario.
- Top of the likely range
- Not reached by 2150 under any scenario.
- If poorly understood ice-sheet processes matter
- Very high emissions by 2150.
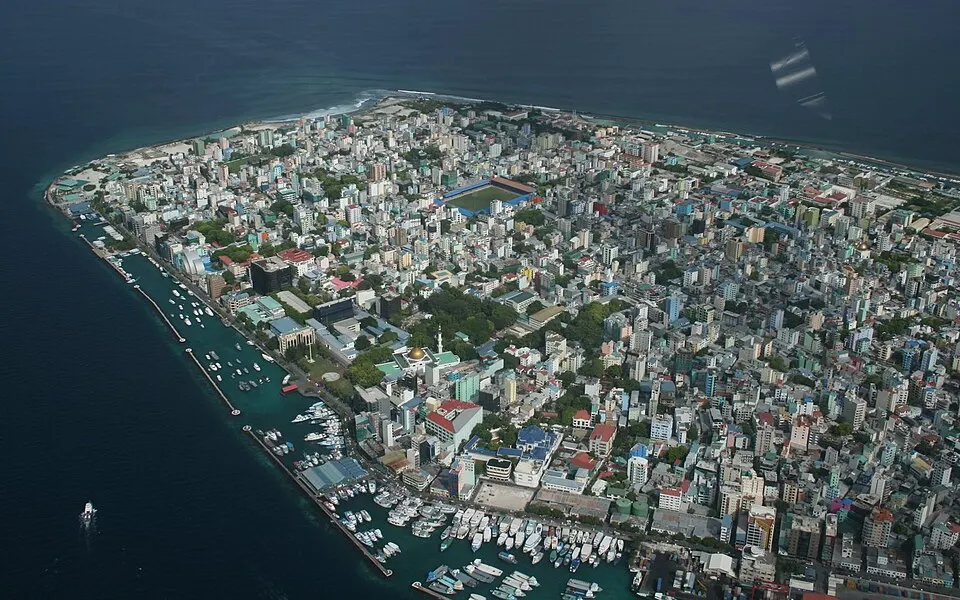 +2 m
The Maldives
Ground averages about 1.5 m, and the highest natural point is 2.4 m.
Malé, the capital of the Maldives, from the air in 2008. Photo: steve_l · CC BY 2.0 · Wikimedia Commons · Wikipedia: Maldives
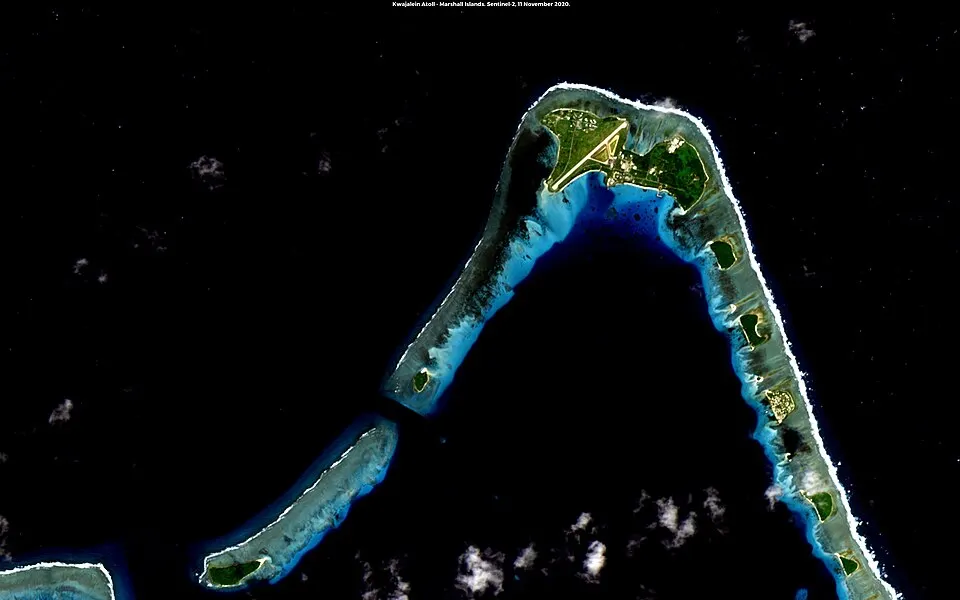 +2 m
Marshall Islands
The average altitude of the whole country is 2.1 m.
Kwajalein Atoll, one of the Marshall Islands, seen from above. Photo: Matt Kieffer · CC BY-SA 2.0 · Wikimedia Commons · Wikipedia: Marshall Islands
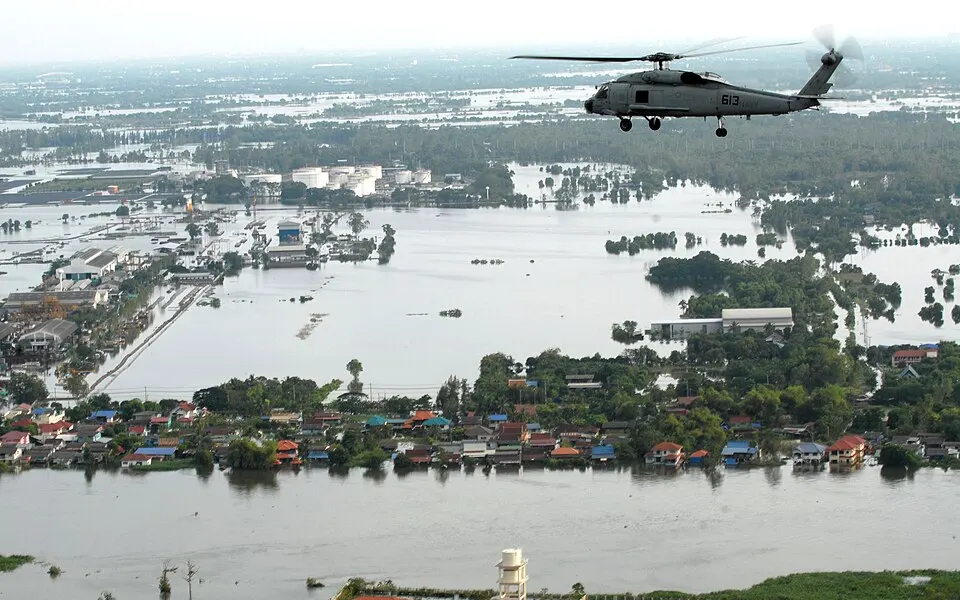 +2 m
Bangkok
The city is flat and low-lying, with an average elevation of 1.5 m.
Flooded districts around Bangkok, October 2011. Photo: U.S. Navy, Jennifer A. Villalovos · Public domain · Wikimedia Commons · Wikipedia: Bangkok
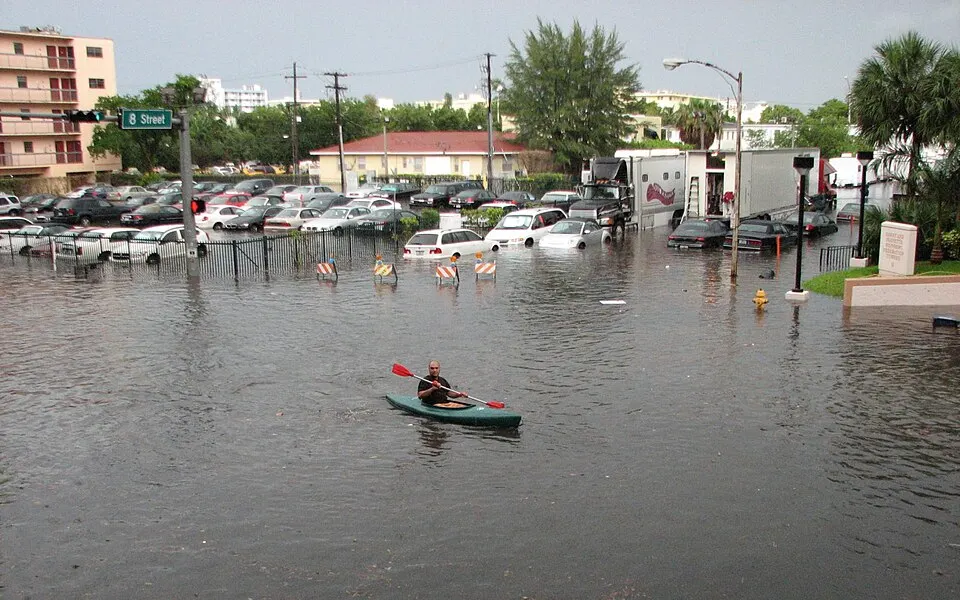 +2 m
Miami
Ground in most neighbourhoods averages about 1.8 m.
A kayak in a flooded Miami Beach street in 2009, during a high tide that rain made worse. Photo: maxstrz on Flickr · CC BY 2.0 · Wikimedia Commons · Wikipedia: Miami
+5 m
Beyond every IPCC projection to 2150, so a measure of scale, not a forecast.
- Central estimate
- Not reached by 2150 under any scenario.
- Top of the likely range
- Not reached by 2150 under any scenario.
- If poorly understood ice-sheet processes matter
- Not reached by 2150 in these projections.
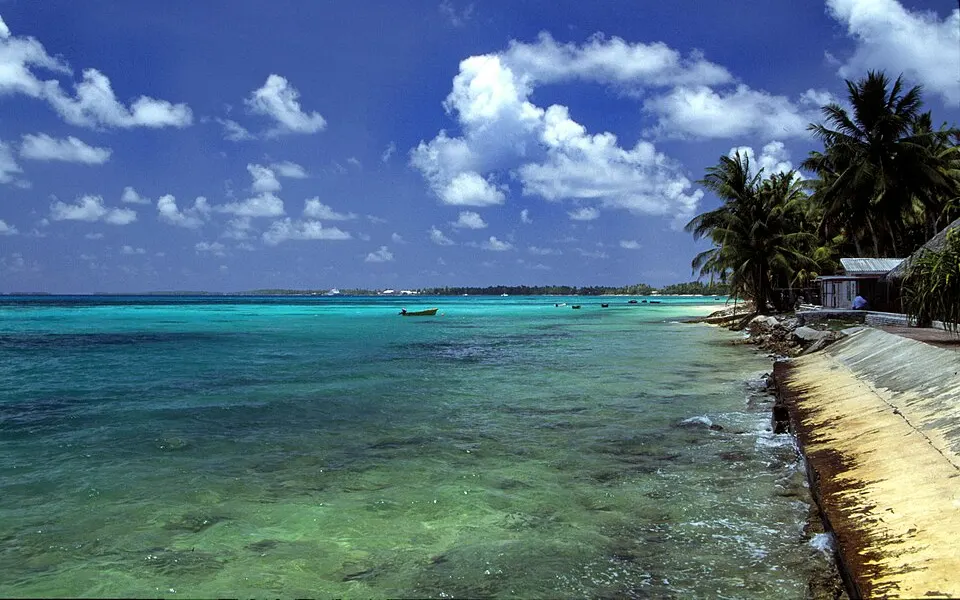 +5 m
Tuvalu
Its highest point is 4.6 m, so every island would be below this level.
A beach on Funafuti atoll, Tuvalu. Photo: Stefan Lins · CC BY-SA 2.0 · Wikimedia Commons · Wikipedia: Tuvalu
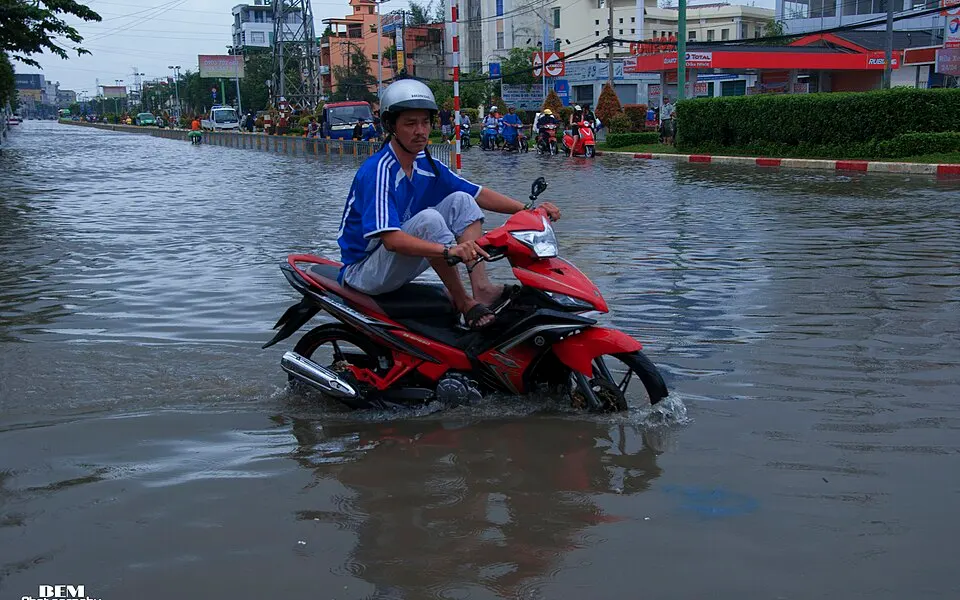 +5 m
Ho Chi Minh City
The average elevation of the city centre is 5 m, and of the suburbs 16 m.
A flooded street in Ho Chi Minh City (Saigon). Photo: Bem Photography · CC BY 2.0 · Wikimedia Commons · Wikipedia: Ho Chi Minh City
For scale, Greenland’s whole ice sheet holds 7.42 m of sea level.
The timing is worked out from the table above: the earliest of 2050, 2100 and 2150 at which a scenario’s figure reaches the level. The IPCC measures from 1995–2014 and the map from today, so treat it as a guide. Places are listed with the figures their sources give, which differ in method and date. Averages hide the low spots, and the amber and blue on the map are the better guide to any one street.
What is making the sea rise?
Two things raise the sea: ice on land that melts into it, and the ocean itself, which takes up more room as it warms. Together they account for about 86% of the rise measured since 1993.
- 42% Warming water expands
- 21% Mountain glaciers
- 15% Greenland
- 8% Antarctica
- 14% Everything else
Share of the global mean sea level rise since 1993. The rest includes changes in water stored on land, the hardest part to measure. Source: WCRP Global Sea Level Budget Group (2018), Earth System Science Data.
Warming water is the largest single cause, at 42%. Water takes up more room as it warms, so a warmer ocean is a higher ocean. The other 44% is meltwater from ice on land, in three very different stores:
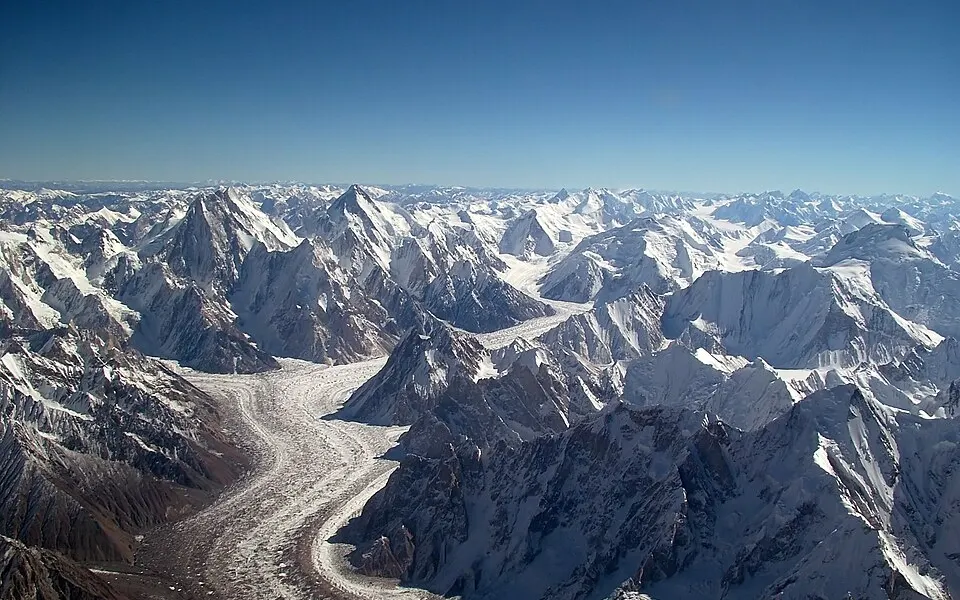 21%
Mountain glaciers
Glaciers outside the two big ice sheets hold only about 0.32 m of sea level between them. Even so, they have supplied about a fifth of the rise since 1993.
The Baltoro Glacier in the Karakoram, from the air. Photo: Guilhem Vellut from Paris · CC BY-SA 2.0 · Wikimedia Commons
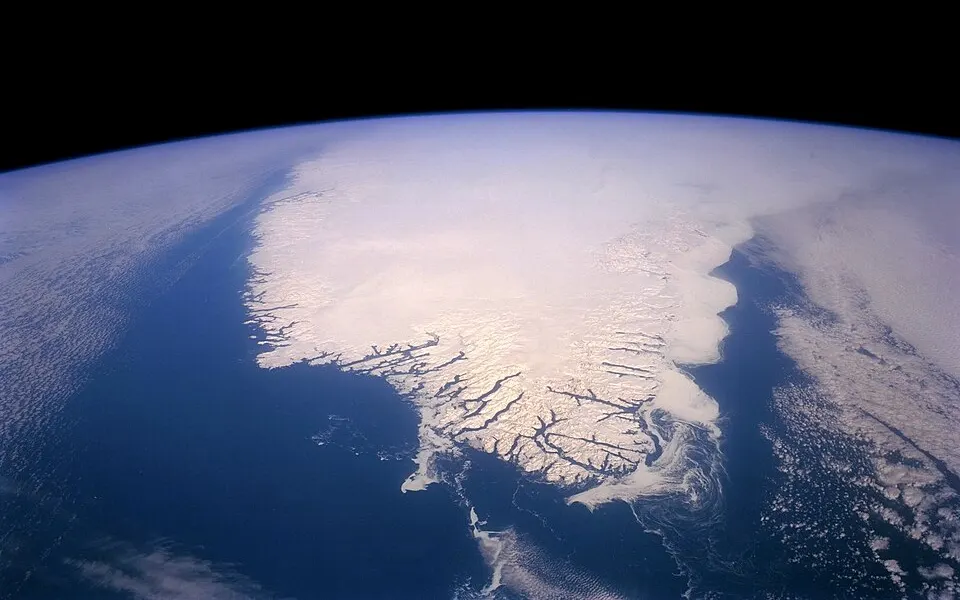 15%
The Greenland ice sheet
Greenland lost about 3,900 gigatonnes of ice between 1992 and 2018, enough to raise the sea by about 11 mm. If all of it melted, the sea would rise 7.42 m, but that would take many centuries.
Source: IMBIE Team (2020), Nature
The Greenland ice sheet from space. Photo: NASA satellite image, via USGS · Public domain · Wikimedia Commons
 8%
The Antarctic ice sheet
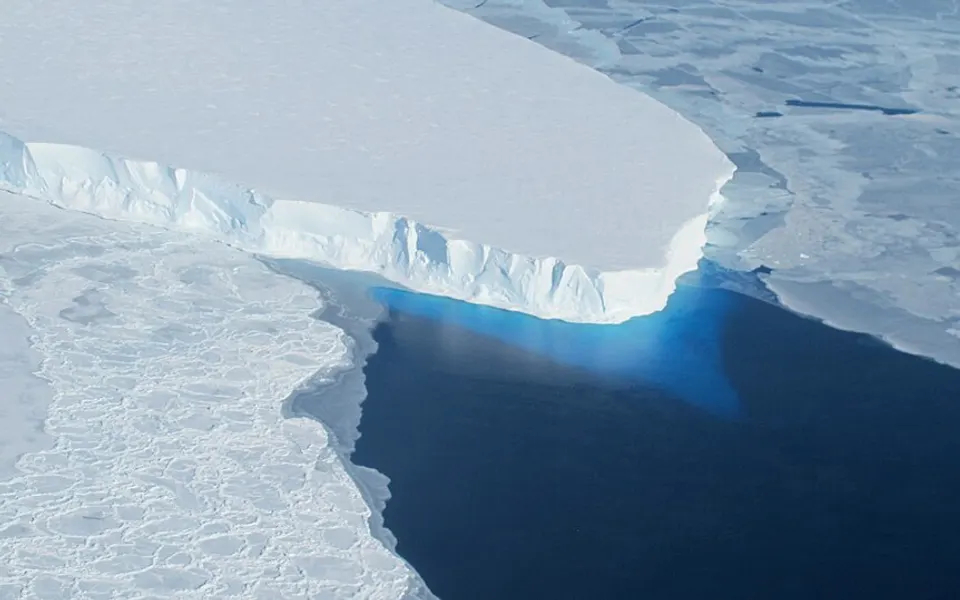
Antarctica holds by far the most ice, 57.9 m of sea level, yet has added the least so far. The worry is in the west: the Thwaites Glacier alone holds about 65 cm, and researchers think its retreat could pull more of the West Antarctic ice sheet with it.
Source: Wikipedia: Thwaites Glacier
The edge of the Thwaites Glacier, West Antarctica. Photo: NASA · Public domain · Wikimedia Commons
Coasts the sea meets first
Eight low-lying places, some of them already dealing with the sea today. Press a button to set the map to that level and fly to the place. The levels are round figures chosen to match each story, not forecasts, and the caveats in “How this map works” apply to all of them.
- Indian Ocean
The Maldives
The lowest country on Earth
The highest natural ground in the Maldives is only 2.4 m above the sea (some sources say 5.1 m), and the average is about 1.5 m. More than 80% of the land is coral islands that rise less than a metre, though where land is built on it has been raised to several metres.
Malé, the capital of the Maldives, from the air in 2008. Photo: steve_l · CC BY 2.0 · Wikimedia Commons · Wikipedia: Maldives
- Pacific Ocean
Tuvalu
Nine low atolls, no hills
Tuvalu’s land area is only about 26 square kilometres, and its highest point is 4.6 m above the sea, on Niulakita. Its atolls already flood in cyclones and storms, and the tide gauge at Funafuti shows the sea rising by 3.9 mm a year, about twice the global average. Yet a study of four decades found that the islets’ land area grew by about 3%, as waves move sand onto their shores, so the picture is not simply one of loss.
A beach on Funafuti atoll, Tuvalu. Photo: Stefan Lins · CC BY-SA 2.0 · Wikimedia Commons · Wikipedia: Tuvalu
- Italy
Venice
A city built in a lagoon
The lowest part of Venice, around St Mark’s Basilica, is only 64 cm above sea level, and between autumn and early spring the city is often threatened by flood tides pushing in from the Adriatic. The MOSE barrier was designed to close the lagoon’s three entrances with 78 gates that rise when tides above 110 cm are forecast.
Piazza San Marco under water during an acqua alta in November 2004. Photo: Wolfgang Moroder · CC BY-SA 3.0 · Wikimedia Commons · Wikipedia: Venice
 Indonesia
Jakarta
A capital that sinks while the sea rises
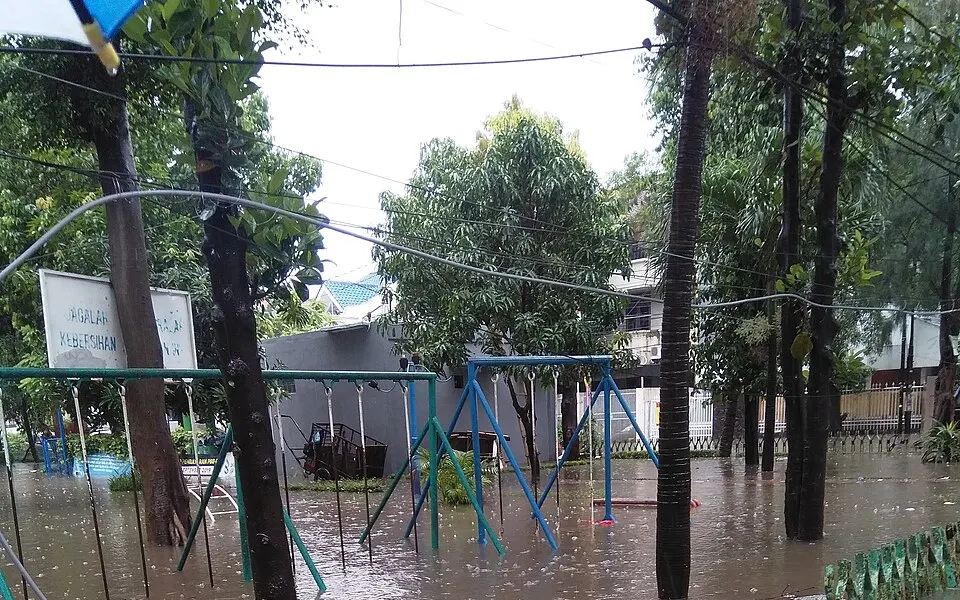
Much of Jakarta lies on a low alluvial plain, with ground from below sea level up to about 50 m. Land subsidence, which pumping groundwater and the weight of buildings make worse, is a major driver of coastal flood risk in the north of the city. In 2022 Indonesia began the legal process of moving its capital to Nusantara, in East Kalimantan.
Houses in Tanjung Duren, Jakarta, flooded on 1 January 2020. Photo: Cun Cun · CC BY-SA 4.0 · Wikimedia Commons · Wikipedia: Jakarta
- The Ganges–Brahmaputra delta
Bangladesh
The biggest river delta in the world
Most of Bangladesh lies less than 12 m above the sea, on the Ganges Delta, the largest river delta in the world. One estimate is that about 10% of its land would flood if the sea rose by 1 m. The map is set to that level: compare it with the estimate.
A floating vegetable garden in Barisal, Bangladesh. Farmers grow crops on rafts that rise with the water. Photo: Azimronnie · CC BY-SA 4.0 · Wikimedia Commons · Wikipedia: Bangladesh
- Florida, USA
Miami
High ground is a few metres at best
Ground in most Miami neighbourhoods averages only about 1.8 m above sea level, and around 40% of homes are built on floodplains. A 2020 report from Resources for the Future named Miami among the world’s cities most vulnerable to storm and coastal flood damage from sea level rise.
A kayak in a flooded Miami Beach street in 2009, during a high tide that rain made worse. Photo: maxstrz on Flickr · CC BY 2.0 · Wikimedia Commons · Wikipedia: Miami
 Louisiana, USA
New Orleans
Below sea level, and only levees between
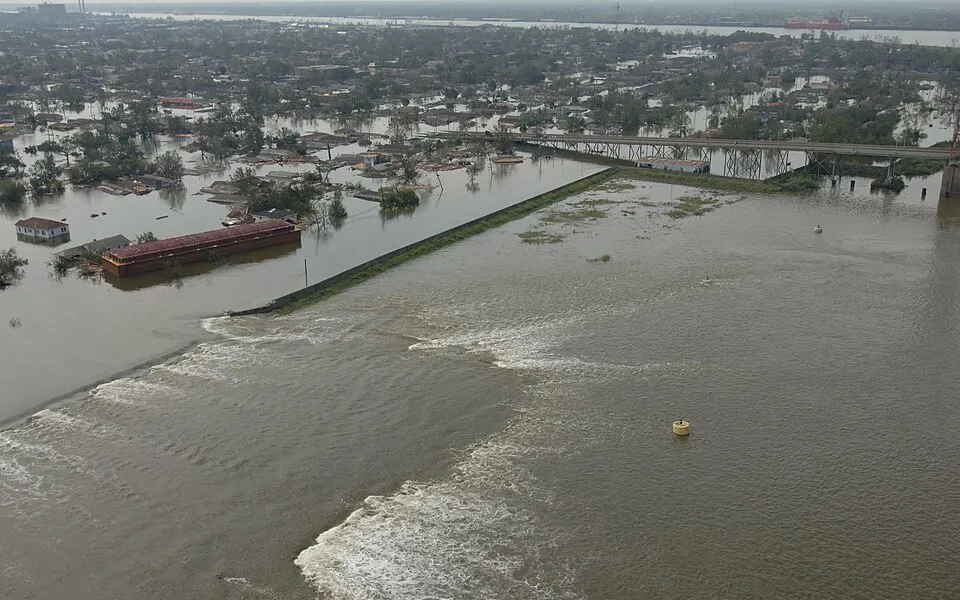
Estimates differ with how sea level is defined, but the city’s ground averages about 0.3 to 0.6 m below it, and the lowest parts of the east side lie about 2 m below. When the federal levee system failed during Hurricane Katrina in August 2005, more than 80% of the city flooded, and the storm killed more than 1,300 people. The button switches on “If the defences failed” at today’s sea level.
A damaged levee beside the Industrial Canal, New Orleans, on 30 August 2005, the day after Katrina. Photo: FEMA · Public domain · Wikimedia Commons · Wikipedia: New Orleans
- Egypt
The Nile Delta
Egypt’s farmland and its second city
One estimate is that a 1 m rise would put about 887,000 people at risk in the Nile Delta and flood about 450 square kilometres, much of it cropland. The delta’s Mediterranean coast is already losing land, because the Aswan Dam has cut off the sediment that once rebuilt it. Alexandria, on its western edge, is one of the cities most exposed to sea level rise.
The Nile Delta at night from the International Space Station. Each cluster of light is a town or city. Photo: ISS Expedition 25 crew · Public domain · Wikimedia Commons · Wikipedia: Nile Delta
Looking for the places that are already below the sea, and how they stay dry? See land below sea level.
The Ice Age coast: four lands that are now sea
About 20,000 years ago the ice sheets held so much water that the sea stood 124 m lower than today’s, the level this map uses (sources often round it to about 120 m). Whole lands that are now sea floor were dry. Press a button to see each one: the sea bed laid bare shows in sand colour. The map does not draw the ice sheets, so the far north shows land that was then under ice.
 The North Sea
Doggerland
When Britain was not an island
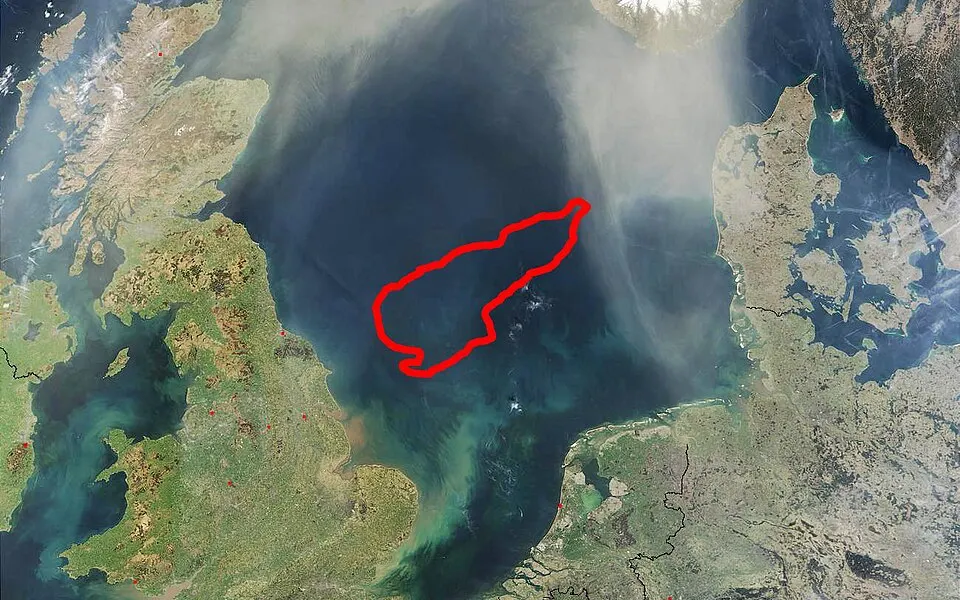
When the sea was this low, much of the southern North Sea was dry land. After the ice retreated, a region joining eastern Britain to Denmark’s Jutland, northern France, Belgium, the Netherlands and north-western Germany was flooded between 10,000 and 7,000 years ago, first into a scatter of low islands and then completely. In 1931 a trawler dragged a barbed antler point out of the sea 40 km east of Norfolk. It dates from between 10,000 and 4,000 BCE, when the spot was tundra.
The Dogger Bank, outlined in red, in a satellite view of the North Sea. Photo: NASA, outline of the Dogger Bank added · Public domain · Wikimedia Commons · Wikipedia: Doggerland
 Between Siberia and Alaska
Beringia
The land bridge to the Americas
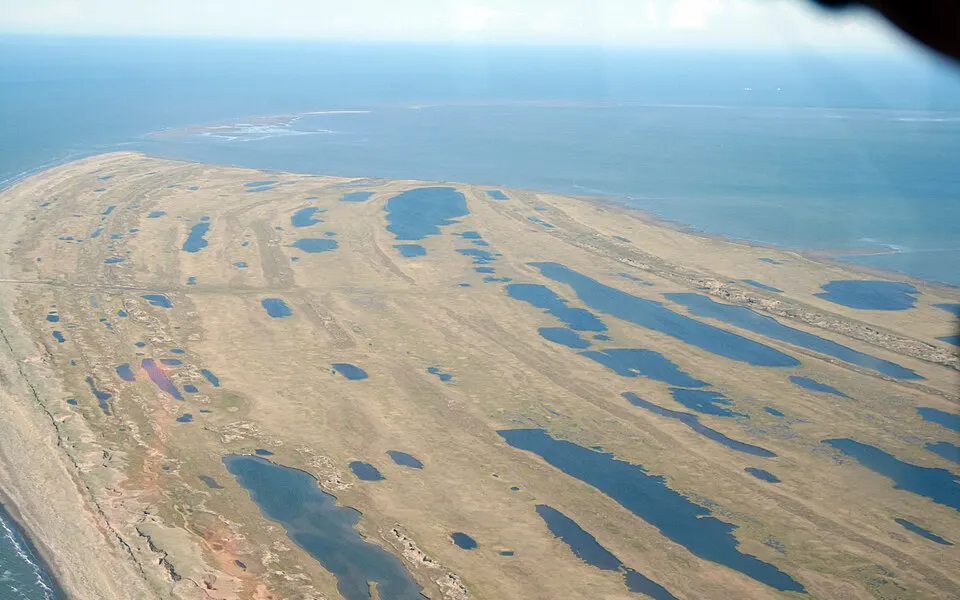
The Bering Strait is only 40–50 m deep, so a land bridge opened as soon as the sea fell by more than 50 m. At its greatest it was up to 1,000 km wide and covered about 1.6 million square kilometres, as much as British Columbia and Alberta together. A small population is thought to have reached Beringia from eastern Siberia at the Ice Age low, before spreading into the Americas.
Tip: The date line cuts Beringia in half, and the flat map stops there, so it shows only the Alaskan side. Switch the map to 3D to see both.
Tundra and thaw lakes at the tip of Cape Espenberg, Bering Land Bridge National Preserve, Alaska. Photo: Greta Burkhart, National Park Service · Public domain · Wikimedia Commons · Wikipedia: Beringia
 Southeast Asia
Sundaland
One landmass where there are now islands
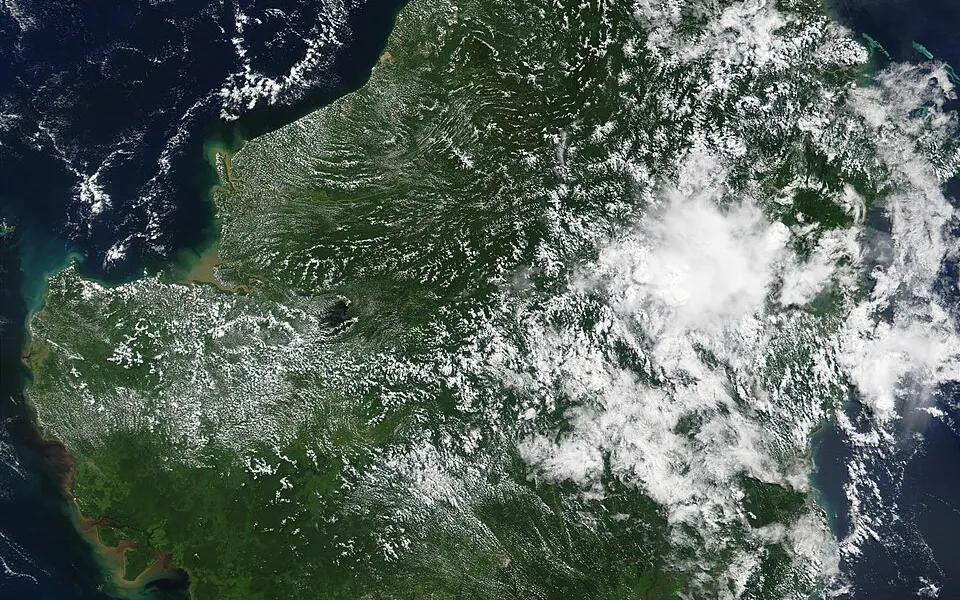
At the Ice Age low the sea fell by about 120 m and the whole Sunda Shelf stood dry, joining Borneo, Java, Sumatra, Bali and the Malay Peninsula into a single landmass. Today’s land is about half its greatest extent. The shelf was flooded between about 18,000 years ago and about 5000 BC.
Borneo from space, in a NASA image from 2002. Photo: NASA MODIS · Public domain · Wikimedia Commons · Wikipedia: Sundaland
 Australia and New Guinea
Sahul
Australia and New Guinea, joined
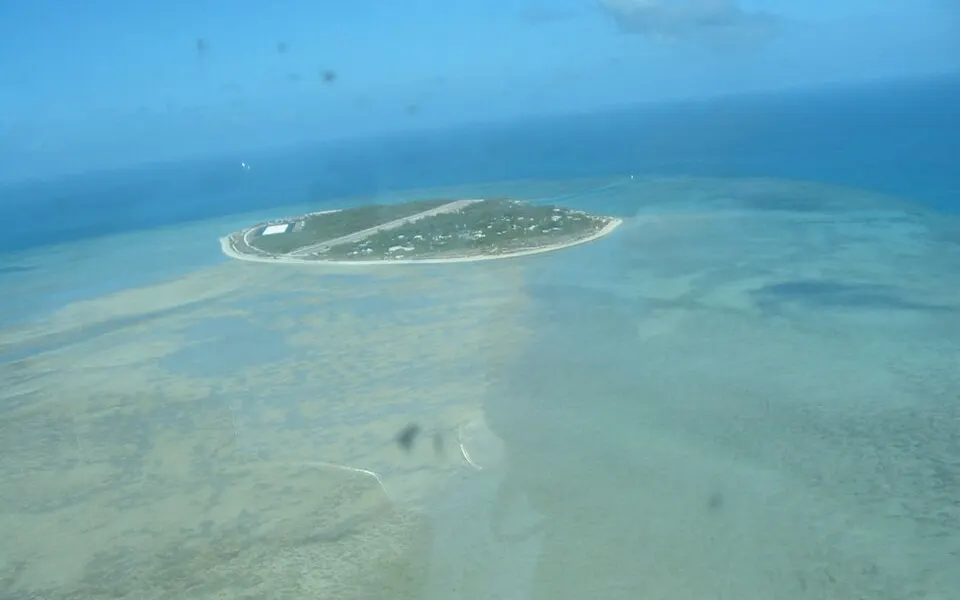
Mainland Australia, Tasmania, New Guinea and the Aru Islands were one continent, called Sahul. As the sea rose at the end of the Ice Age, New Guinea separated from the mainland about 8,000 years ago and Tasmania about 6,000 years ago.
Warraber Island in the Torres Strait, which now lies between Australia and New Guinea. Photo: DE Hart · Public domain · Wikimedia Commons · Wikipedia: Sahul
How this map works, and what it leaves out
What it draws. Ground lower than the sea level you choose turns blue. If the sea falls, the sea bed it uncovers turns sand-coloured.
Water needs a way in. We calculated the height of the rim around closed basins worldwide. These stay dry until the sea tops the rim, and then flood. Small hollows, and basins behind narrow gaps our data cannot see, may still flood too early or too late.
Defences. At today’s sea level, known polders such as the Netherlands show in amber as held dry, and they stay that way as the sea rises until you switch on “If the defences failed”. Real defences have limits, so a very high sea would overtop them. Other coastal walls are not modelled.
What it ignores. Tides, storm surges and waves. Land sinking or rising, including the rebound of land relieved of ice. The ice itself: Greenland and Antarctica stay on the map even when you melt them. Enclosed seas such as the Mediterranean simply fall with the ocean, although in reality they could be cut off.
How accurate it is. On coasts between 60° south and 60° north, heights come from DiluviumDEM, satellite data corrected for trees and buildings, at about 38 m detail where the most ground lies under 10 m. It is still typically a metre or two out on low ground, and it could be tested only in places with laser surveys, so elsewhere is less certain. Elsewhere, and when zoomed out on smaller coasts, heights are uncorrected global data that can read several metres too high over cities and forests. So rises under a metre are only a rough guide everywhere. The amber polder shapes come from better data, including national laser surveys, so where a tap and a shape disagree, trust the shape. For planning, use local surveys and your flood authority’s maps.
Frequently Asked Questions
Which cities will be underwater?
No one can say for a whole city, because it depends on the height of each street, on sinking land and on defences. The IPCC’s central estimates for 2100 run from 0.38 m to 0.77 m. The places that meet the sea first are river deltas such as the Mekong, the Ganges–Brahmaputra and the Nile, coral atolls such as the Maldives, Tuvalu and the Marshall Islands, and low cities such as Venice, Bangkok and Miami. The map has buttons that show each at one, two and five metres.
When did Britain become an island?
Britain was joined to the continent by Doggerland, a low plain that is now the southern North Sea. As the ice melted, the rising sea flooded it between 10,000 and 7,000 years ago, first breaking it into low islands and then covering it completely. Choose “Ice Age” on the map and look at the North Sea to see the land that was lost.
What is causing sea level to rise?
Mainly two things. The ocean expands as it warms, which accounts for about 42% of the rise measured since 1993, and meltwater from land ice supplies about 44%: 21% from mountain glaciers, 15% from Greenland and 8% from Antarctica. The rest includes changes in the water stored on land.
Which places are most at risk from sea level rise?
Low coral islands such as the Maldives and Tuvalu, big river deltas such as the Ganges–Brahmaputra and the Nile, and sinking coastal cities such as Jakarta. How much a place is at risk depends on its height, on whether the land is sinking, on storms and on its defences, not on the sea level alone. The page above shows eight examples, each with a button that sets the map to match.
How much will sea level rise by 2100?
The IPCC’s central estimates for 2100 run from about 0.38 m under very low emissions to 0.77 m under very high emissions, compared with 1995–2014. The likely range under very high emissions reaches 1.02 m. If poorly understood ice-sheet processes turn out to matter, the top of the range could reach about 1.6 m.
Is this map a flood forecast?
No. It shows which ground is lower than a chosen sea level and has a path for water to reach it. It leaves out tides, storm surges, waves, sinking land and most sea walls, and the height data can be several metres off in low, built-up or forested areas. Use it to understand scale, not to judge the risk to a particular property.
Why does the Dead Sea stay dry when the sea rises?
Because water cannot reach it. We calculated the height of the rim around every large closed basin on Earth. The Dead Sea, the Caspian and Death Valley stay dry on this map until the sea climbs over that rim, even though they already lie below sea level. Many simple flood maps turn them blue straight away.
Why is the Netherlands not under water at 0 m?
Because dikes, dunes and pumps keep it dry. Land like this shows in amber at today’s sea level. Open “More levels and options” on the map and tick “If the defences failed” to see it turn blue.
How much would sea level rise if all the ice melted?
About 65.6 m: 57.9 m from Antarctica, 7.42 m from Greenland and 0.32 m from all other glaciers. That would take many centuries to thousands of years. No IPCC scenario has it happening this century.
How low was sea level in the Ice Age?
About 124 m below today’s, around 20,000 years ago. Britain was joined to Europe across Doggerland, and Asia to Alaska across Beringia. Choose “Ice Age” on the map to see them.
How many people live on land at risk?
Estimates depend heavily on the height data. One study using satellite lidar put 267 million people on land under 2 m above sea level in 2020. Another estimated 110 million living below the current high-tide line, many of them behind defences.
People at risk: Hooijer & Vernimmen (2021); Kulp & Strauss (2019). Ice: BedMachine (Morlighem et al.) and Farinotti et al. (2019), via AntarcticGlaciers.org. Ice Age level: PaleoMIST (Gowan et al. 2021). Heights: Mapterhorn, Terrain Tiles and NOAA ETOPO 2022; see data sources.